Dose Response Curve
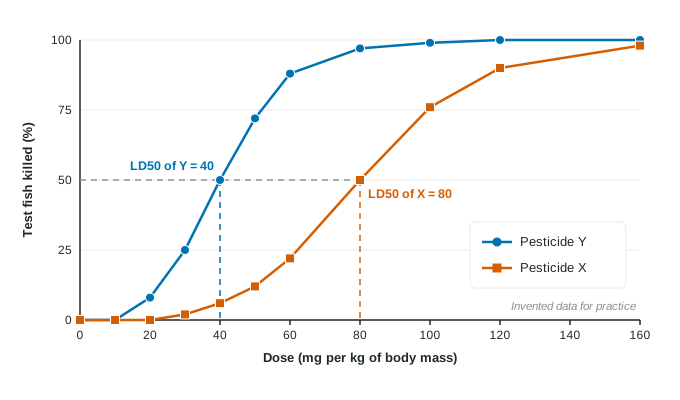
A dose-response curve shows the percent of a test group responding at each dose.
Part 1 · Hook
Why this matters
Part 2 · Before you start
What this builds on
Part 3 · Prerequisite check
Quick check before you start
1. Pesticide A has an LD50 of 15 mg/kg and pesticide B has an LD50 of 150 mg/kg. Which is more toxic?
- A, because less of it kills half the test animals
- B, because its LD50 is larger
- They are equally toxic
- It cannot be told from LD50 values
Show the answer
A lower LD50 means a smaller dose kills half the animals, so A is more toxic.
- Correct: A, because less of it kills half the test animals:
- B, because its LD50 is larger:
- They are equally toxic:
- It cannot be told from LD50 values:
2. What is the dose for a 2 kg animal of a chemical given at 30 mg/kg?
- 60 mg
- 15 mg
- 32 mg
- 0.067 mg
Show the answer
.
- Correct: 60 mg:
- 15 mg:
- 32 mg:
- 0.067 mg:
Part 4 · See it
See it first
Part 5 · Step by step
How it works, step by step
- Below the threshold dosethe test group shows no measurable response, so the curve sits at zero
- Above the threshold, each larger doseaffects a larger percent of the group, and the curve rises steeply through 50%
- Reading across from 50% to the curve and downgives the LD50 for deaths or the ED50 for another effect
- A curve that rises at lower dosesbelongs to the more toxic substance
Part 6 · Key ideas
Key ideas
- A dose-response curve plots dose (mg/kg) on the horizontal axis against the percent of a test group responding on the vertical axis. It is usually S-shaped.
- The threshold dose is where the curve leaves zero: the highest dose with no observed response.
- The LD50 is read at 50% on a curve of deaths. The ED50 (effective dose 50%) is read at 50% on a curve of a nonlethal effect, such as illness or sleep.
- To compare substances, compare where their curves rise: the curve to the left belongs to the more toxic substance.
Part 7 · Misconception
A common mistake
The wrong idea: If a dose is below a substance’s LD50, it is safe.
What actually happens: Below the LD50, up to half of the test animals can still die, and nonlethal harm can start at much lower doses. Only the threshold dose marks where no effect was seen, and some substances have no threshold at all.
Part 8 · Check yourself
Check yourself
Exam-style questions. Anything you miss goes into your review queue.
1. On a dose-response curve, what is the threshold dose?
- The dose at which half of the test animals die
- The highest dose at which no response is seen
- The largest dose that was tested in the study
- The dose at which about 99% of test animals die
Show the answer
The threshold dose is where the curve leaves zero: below it, no effect is observed in the test group.
- The dose at which half of the test animals die: That is the LD50, read at 50% on the response axis.
- Correct: The highest dose at which no response is seen: Right: below the threshold, the test group shows no measurable effect.
- The largest dose that was tested in the study: The largest dose tested is the end of the curve, not its threshold.
- The dose at which about 99% of test animals die: At the top of the curve nearly all animals respond; the threshold is at the bottom.
Data
Fish killed by two pesticides at each dose
| Dose (mg/kg) | Pesticide X: killed (%) | Pesticide Y: killed (%) |
|---|---|---|
| 0 | 0 | 0 |
| 10 | 0 | 0 |
| 20 | 0 | 8 |
| 30 | 2 | 25 |
| 40 | 6 | 50 |
| 50 | 12 | 72 |
| 60 | 22 | 88 |
| 80 | 50 | 97 |
| 100 | 76 | 99 |
| 120 | 90 | 100 |
| 160 | 98 | 100 |
2. What is the LD50 of pesticide Y in the fish?
Type a number, then its unit (mg/kg). Scale words (2.5 million) and powers of ten (2.5 × 10^6) are read.
Show the answer
Pesticide Y kills 50% of the fish at 40 mg/kg, so its LD50 is 40 mg/kg.
- Answer: 40 mg/kg
3. From the table, what is the threshold dose for pesticide X: the highest dose tested that killed no fish?
Type a number, then its unit (mg/kg). Scale words (2.5 million) and powers of ten (2.5 × 10^6) are read.
Show the answer
Pesticide X kills 0% at 0, 10 and 20 mg/kg and 2% at 30 mg/kg, so its threshold lies at 20 mg/kg (between 20 and 30).
- Answer: 20 mg/kg
4. Which statement compares the two pesticides correctly?
- X is twice as toxic as Y, since its LD50 is twice as large
- They are equally toxic, since both kill about 98% or more of the fish at 160 mg/kg
- Y is twice as toxic as X: its LD50 is half of X’s
- X is more toxic, since its curve keeps rising to a higher dose
Show the answer
Compare LD50s by division:
- X is twice as toxic as Y, since its LD50 is twice as large: A larger LD50 means more pesticide is needed to kill, so X is less toxic.
- They are equally toxic, since both kill about 98% or more of the fish at 160 mg/kg: Toxicity is compared at the 50% point, where Y needs half the dose X does.
- Correct: Y is twice as toxic as X: its LD50 is half of X’s: Right: the LD50 of Y is 40 mg/kg and of X is 80 mg/kg, and .
- X is more toxic, since its curve keeps rising to a higher dose: X rises later because it is less toxic; more of it is needed for the same effect.
5. A farmer worries about runoff of pesticide X into a pond. Using the LD50 from the table, write the setup for the dose of X, in milligrams, expected to kill half of a group of 0.60 kg fish. Then give the answer.
Type the setup as on the exam, with brackets and units, then the answer.
Show the answer
- Setup: ; answer 48 mg
6. A town must choose one of the two pesticides for fields that drain into a fish pond. Based only on these data, which choice is better for the fish, and why?
- X, because a larger dose of it is needed before fish start to die
- Y, because its curve reaches 100% faster, so it breaks down sooner
- Y, because it kills fish at lower doses, so less of it reaches the pond
- Either one, because both kill about 98% or more of the fish at high doses
Show the answer
At every dose from 20 to 80 mg/kg, Y kills a larger percent of fish than X, and its threshold and LD50 are both lower.
- Correct: X, because a larger dose of it is needed before fish start to die: Right: X has the higher threshold (about 20 mg/kg) and the higher LD50 (80 mg/kg).
- Y, because its curve reaches 100% faster, so it breaks down sooner: How fast a curve rises with dose says nothing about how fast the pesticide breaks down.
- Y, because it kills fish at lower doses, so less of it reaches the pond: Killing fish at lower doses makes Y more dangerous to them, not less.
- Either one, because both kill about 98% or more of the fish at high doses: At the doses most likely in runoff, the low end of the curves, Y kills far more fish.
7. Put the steps for reading an LD50 off a dose-response curve in order.
- Find 50% on the vertical (response) axis
- Go straight across to the curve
- Go straight down from that point to the dose axis
- Read the dose and write it with its unit, mg/kg
Show the answer
Across from 50%, down to the dose axis, then read the value with its unit.
- Correct order: 1. Find 50% on the vertical (response) axis 2. Go straight across to the curve 3. Go straight down from that point to the dose axis 4. Read the dose and write it with its unit, mg/kg
Part 9 · Summary
Summary
Part 10 · Up next
What comes next
Part 11 · Connections