Rational Functions and End Behavior
A rational function's end behavior matches the quotient of its leading terms.
Part 1 · Hook
Why this matters
Part 2 · Before you start
What this builds on
Part 3 · Prerequisite check
Quick check before you start
1. What is ?
Show the answer
The leading term is negative and huge for large negative .
- Correct: :
- :
- :
- :
2. Which is equal to for ?
Show the answer
Divide each term by .
- Correct: :
- :
- :
- :
Part 4 · See it
See it first
Part 5 · Step by step
How it works, step by step
- grows large in each polynomial behaves like its leading term, so the function behaves like their quotient
- The quotient of leading terms is a constant (equal degrees) and is a horizontal asymptote
- The denominator has the higher degreethe quotient goes to : the horizontal asymptote is
- The quotient of leading terms is linear (top degree one more)the graph approaches a slant asymptote
Part 6 · Key ideas
Key ideas
- A rational function is with polynomials and .
- End behavior comes from the quotient of the leading terms, written in limit notation.
- Horizontal asymptote when or : equal degrees give the ratio of leading coefficients; a bigger bottom degree gives .
- Slant asymptote when the top's degree is one more: rewrite as a line plus a fraction that goes to .
Part 7 · Misconception
A common mistake
The wrong idea: A graph can never cross its horizontal asymptote.
What actually happens: A horizontal asymptote describes the ends only. has asymptote yet crosses it at .
Part 8 · Check yourself
Check yourself
Exam-style questions. Anything you miss goes into your review queue.
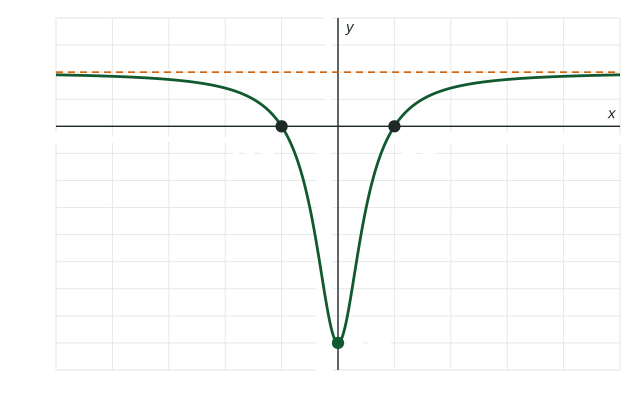
Graph
The graph of
1. Which describes the right end of the graph of ?
Show the answer
For large , behaves like : .
- : Top and bottom both have degree , so their quotient levels off.
- : is the limit when the denominator has the higher degree; here the degrees are equal.
- Correct: : Right: the quotient of the leading terms is .
: is , the -intercept.
2. What is the horizontal asymptote of the graph of ?
Show the answer
, so the line is a horizontal asymptote.
- Correct: : Right: the outputs approach as .
- : would need the denominator to have the higher degree.
- : A horizontal asymptote is a horizontal line, .
- : That is the ratio of the constant terms, ; end behavior uses the leading terms.
3. For large values of , are the outputs of above or below ?
- Above , because the graph rises toward the asymptote
- Below , because
- Exactly once is large enough
- Above on the right and below on the left
Show the answer
, so . The fraction is positive and shrinks toward : the outputs climb toward from below.
- Above , because the graph rises toward the asymptote: Rising toward from below means the outputs are under .
- Correct: Below , because : Right: the subtracted fraction is positive, so for every .
- Exactly once is large enough: gets small but never reaches .
- Above on the right and below on the left: is even: , so both sides behave alike.
Table
Outputs far from the origin
| -100 | -10 | 10 | 100 | 1000 | |
|---|---|---|---|---|---|
| -0.0498 | -0.4752 | 0.5149 | 0.0502 | 0.0050 |
4. The table gives values of . What is ?
Show the answer
, which goes to . The table agrees: , , .
- : is the leading coefficient of the top; the bottom's degree is higher.
- Correct: : Right: the outputs shrink toward as grows.
- : The outputs get smaller, not larger: at .
- : is the constant term of the numerator.
5. The table gives values of . Why does have the horizontal asymptote ?
- Because
- Because the numerator has a zero at
- Because the denominator has the higher degree
- Because the outputs are negative when
Show the answer
When the denominator's degree is greater, the quotient of leading terms ( here) goes to at both ends.
- Because : The value at does not describe the ends of the graph.
- Because the numerator has a zero at : One zero says nothing about large .
- Correct: Because the denominator has the higher degree: Right: outgrows , so the quotient shrinks toward .
- Because the outputs are negative when : The sign tells which side of the outputs are on, not why they approach .
6. Find the slant asymptote of .
Type an expression for .
Show the answer
. As , , so the graph approaches the line .
- Answer:
Part 9 · Summary
Summary
Part 10 · Up next
What comes next
Part 11 · Connections