Function Model Selection and Assumption Articulation
Choose a model type from the changes over equal input steps and from the context, then state the domain and range the context allows and the assumptions the model makes.
Part 1 · Hook
Why this matters
Part 2 · Before you start
What this builds on
Part 3 · Prerequisite check
Quick check before you start
1. Outputs over equal input steps are . What are the second differences?
Show the answer
First differences: . Second differences: .
- Correct: :
- :
- :
- :
2. What is the degree of ?
Show the answer
Three linear factors multiply to degree .
- Correct: :
- :
- :
- :
Part 4 · See it
See it first
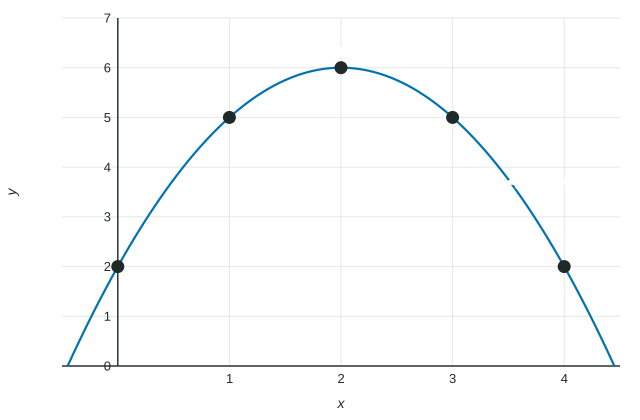
Part 5 · Step by step
How it works, step by step
- Look at the changes in output over equal input stepsconstant first differences suggest linear; constant second differences suggest quadratic
- Look at the contextarea suggests degree 2, volume degree 3, different rules on different intervals suggest piecewise
- Ask what the context allowsrestrict the domain and range, and state the assumptions the model makes
Part 6 · Key ideas
Key ideas
- A function model is chosen from the data (the pattern of changes) and from the context (what the quantity measures).
- Linear: constant rate of change. Quadratic: the rate of change changes at a constant rate, or one extremum with symmetry. Piecewise: different behavior on different intervals.
- A model is only trusted for inputs the context allows: no negative times, no heights below the ground, no cuts bigger than the sheet.
Part 7 · Misconception
A common mistake
The wrong idea: The best model is the one that passes through every data point.
What actually happens: The best model matches the pattern in the data and makes sense in the context; an exact fit can bend in ways the situation does not support.
Part 8 · Check yourself
Check yourself
Exam-style questions. Anything you miss goes into your review queue.
Table
Height of a tossed beanbag
| (seconds) | 0 | 0.5 | 1 | 1.5 | 2 |
|---|---|---|---|---|---|
| (feet) | 6 | 18 | 22 | 18 | 6 |
1. The inputs in the table are equally spaced. Which type of function model fits the data best?
- Linear, because the outputs rise and then fall by equal amounts
- Quadratic, because the second differences are constant
- Quadratic, because the first differences are constant
- Cubic, because there are five data points
Show the answer
Over equal input steps of , the first differences are and the second differences are . Constant second differences over equal steps mean a quadratic model.
- Linear, because the outputs rise and then fall by equal amounts: A linear model has constant first differences; these change from to .
- Correct: Quadratic, because the second differences are constant: Second differences of each time, over equal steps.
- Quadratic, because the first differences are constant: The first differences change; it is the second differences that are constant.
- Cubic, because there are five data points: Five points do not force a cubic; the pattern of differences decides the type.
2. Over the equal input steps of the table, what is the constant second difference of ?
No calculator. Type the exact value (a fraction, π, e or a root is fine).
Show the answer
First differences: , , , . Second differences: each time.
- Answer: -8
3. A quadratic model fits the table. For which inputs does the context allow the model to be used?
- Any real number
- , the inputs in the table
- From until reaches its maximum at
- From until the time when
Show the answer
Time starts at the toss, , and the model stops describing the beanbag when it reaches the ground, where . After that the model gives negative heights, which the context does not allow.
- Any real number : Negative times come before the toss, and late times give negative heights.
- , the inputs in the table: The beanbag is still in the air at ; the model can be used until it lands.
- From until reaches its maximum at : The beanbag keeps falling after its highest point, and the model still describes it.
- Correct: From until the time when : The toss starts the clock and the ground ends the flight.
Graph
Volume of an open box
4. What domain does the context allow for the volume model?
Show the answer
The cut must have positive size, and two cuts of must fit along a -inch side: , so . At there is no base left.
- : Two cuts come out of each side, so .
- : A cut of inches is impossible on a -inch sheet.
- Correct: : Positive cuts that leave a base.
- : These are only the cut sizes plotted; any size between and makes a box.
5. For a function on equal input intervals, the average rates of change are . Which model type fits?
- Linear
- Cubic
- Quadratic
- Piecewise-defined, with two constant pieces
Show the answer
The average rates of change increase by each time: the rate of change changes at a constant rate. That is the pattern of a quadratic.
- Linear: A linear function has the same rate on every interval.
- Cubic: A cubic's rates change by changing amounts.
- Correct: Quadratic: A rate of change that changes linearly gives a quadratic.
- Piecewise-defined, with two constant pieces: Constant pieces would have rates of .
6. A linear model gives the temperature, in degrees Celsius, of soup minutes after it is set on a counter in a -degree room. Which restriction on the domain does the context suggest?
- , because after that the model gives temperatures below the room's
- , because is at
- , because time is not negative
- , because the soup starts at degrees
Show the answer
Soup cools toward room temperature and does not go below it. at , so the model is reasonable only for .
- Correct: , because after that the model gives temperatures below the room's: Set : .
- , because is at : The soup never cools to degrees in a -degree room.
- , because time is not negative: The upper end matters too: the model drops below room temperature.
- , because the soup starts at degrees: The starting temperature is an output, not a bound on time.
Part 9 · Summary
Summary
Part 10 · Up next
What comes next
Part 11 · Connections