Summary Statistics for One Quantitative Variable
The mean and standard deviation use every value, so outliers and skew pull them; the median and IQR are resistant.
Part 1 · Hook
Why this matters
Part 2 · Before you start
What this builds on
Part 3 · Prerequisite check
Quick check before you start
1. Evaluate .
- 6
- 11.33
- 18
- 3
Show the answer
Add the top first: 18, then divide by 3.
- Correct: 6:
- 11.33:
- 18:
- 3:
2. Which shape has a long tail toward the larger values?
- Skewed right
- Skewed left
- Uniform
- Symmetric
Show the answer
Skew is named for the tail.
- Correct: Skewed right:
- Skewed left:
- Uniform:
- Symmetric:
3. What is , to two decimal places?
- 3.61
- 2.55
- 13
- 6.5
Show the answer
and .
- Correct: 3.61:
- 2.55:
- 13:
- 6.5:
Part 4 · See it
See it first
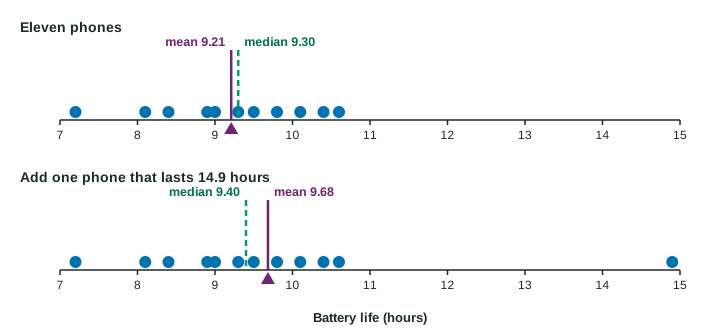
Part 5 · Step by step
How it works, step by step
- The mean adds every value and divides by none extreme value pulls it toward the tail
- The median and quartiles depend only on the order of the valuesthey barely move when an extreme value changes: they are resistant
- The standard deviation squares each distance from the meanit measures typical distance from the mean, and an outlier inflates it
- So for skewed data or outliersreport the median and IQR; for roughly symmetric data, the mean and standard deviation
Part 6 · Key ideas
Key ideas
- Mean ; median: the middle of the ordered values (the average of the two middle ones when n is even).
- Quartiles: and are the medians of the lower and upper halves (leave out the median when n is odd). ; range = max − min.
- Standard deviation
, the typical distance from the mean; variance is . Population versions: and . - Outliers: beyond or , or more than 2 standard deviations from the mean.
- Adding a constant shifts the center but not the spread; multiplying by a constant multiplies both.
Part 7 · Misconception
A common mistake
The wrong idea: The mean is always the best measure of center, because it uses every value.
What actually happens: Using every value is what makes the mean sensitive to extreme values. With strong skew or outliers, the resistant median describes a typical value better.
Part 8 · Check yourself
Check yourself
Exam-style questions. Anything you miss goes into your review queue.
Graph
Battery life of 12 phones
1. What is the mean battery life, in hours?
Type a number, in hours. A table answer and a calculator answer are both accepted.
Show the answer
- Answer: 9.68 hours
2. What is the median battery life, in hours?
Type a number, in hours. A table answer and a calculator answer are both accepted.
Show the answer
With , the median is the average of the 6th and 7th ordered values: hours.
- Answer: 9.4 hours
3. What is the interquartile range (IQR) of the battery lives, in hours?
Type a number, in hours. A table answer and a calculator answer are both accepted.
Show the answer
Lower half 7.2 to 9.3:
- Answer: 1.6 hours
4. What is the standard deviation of the battery lives, in hours? Use the sample standard deviation.
Type a number, in hours. A table answer and a calculator answer are both accepted.
Show the answer
- Answer: 1.91 hours
5. Which battery lives are outliers by the rule?
- 7.2 and 14.9 hours
- 14.9 hours alone
- No phone, since 14.9 is below twice the mean of 9.68 hours
- 10.6 and 14.9 hours
Show the answer
Fences: and . Only 14.9 lies outside.
- 7.2 and 14.9 hours: 7.2 is above the lower fence of 6.25, so it is not an outlier.
- Correct: 14.9 hours alone: Right: the fences are and ; only 14.9 is outside.
- No phone, since 14.9 is below twice the mean of 9.68 hours: Twice the mean is not an outlier rule. Use the fences: 14.9 is above 12.65.
- 10.6 and 14.9 hours: Values above are common; an outlier must be beyond the fence, 12.65.
6. A student’s score is at the 80th percentile of a test. What does that tell you?
- 80% of the scores are at or below this score
- The student answered 80% of the questions correctly
- The score was 80 points
- 80 students scored higher than this student on the test
Show the answer
The pth percentile is the value with p% of the data at or below it.
- Correct: 80% of the scores are at or below this score: Right: a percentile tells the percent of the data at or below a value.
- The student answered 80% of the questions correctly: A percentile is about position among scores, not the percent correct.
- The score was 80 points: A percentile is not a score; it tells where a score stands.
- 80 students scored higher than this student on the test: A percentile is a percent of the data below, not a count above.
7. Which summaries are resistant to an extreme outlier? Select all that apply.
- The median
- The IQR
- The mean
- The standard deviation
- The range
Show the answer
The median and IQR are resistant; the mean, standard deviation and range are not.
- Correct: The median: Right: it depends on the middle of the ordered data.
- Correct: The IQR: Right: it depends on the quartiles, not the extremes.
- The mean: The mean adds in the outlier, so it moves toward it.
- The standard deviation: An outlier far from the mean makes one squared distance huge.
- The range: The range uses the maximum or minimum, which may be the outlier.
Part 9 · Summary
Summary
Part 10 · Up next
What comes next
Part 11 · Connections