Semi-log Plots
A semi-log plot puts one axis on a logarithmic scale.
Part 1 · Hook
Why this matters
Part 2 · Before you start
What this builds on
Part 3 · Prerequisite check
Quick check before you start
1. On a logarithmic scale, the labels , , are equally spaced. What does each step do?
- Multiplies by
- Adds
- Adds
- Multiplies by
Show the answer
Equal distances are equal factors.
- Correct: Multiplies by :
- Adds :
- Adds :
- Multiplies by :
2. Which is equal to ?
Show the answer
Product property, then power property.
- Correct: :
- :
- :
- :
3. An exponential model has . What happens to when increases by ?
- It is multiplied by
- It increases by
- It is multiplied by
- It increases by
Show the answer
is the growth factor.
- Correct: It is multiplied by :
- It increases by :
- It is multiplied by :
- It increases by :
Part 4 · See it
See it first
Part 5 · Step by step
How it works, step by step
Part 6 · Key ideas
Key ideas
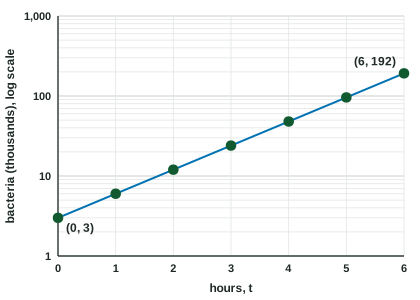
- A semi-log plot has one axis (usually the vertical one) on a logarithmic scale with some base .
- Exponential data look linear on it, because
. - From the line: and . With a natural-log scale, use .
- A function with a vertical shift, with , does not give a line.
Part 7 · Misconception
A common mistake
The wrong idea: A line on a semi-log plot means the data are linear, so the slope is the amount added each step.
What actually happens: The vertical scale shows . A line means is linear, so is exponential: the slope is , and each step multiplies by .
Part 8 · Check yourself
Check yourself
Exam-style questions. Anything you miss goes into your review queue.
Graph
Users of an app on a semi-log plot
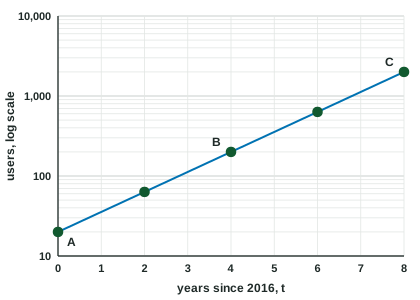
1. The data lie on a straight line on this semi-log plot. What does that show about the number of users?
- It grows exponentially, by the same factor in equal times
- It grows linearly: equal time steps add the same number of users
- It grows like a quadratic: its second differences are constant
- It grows logarithmically: it rises by equal steps as doubles
Show the answer
On a logarithmic vertical scale, equal vertical steps are equal factors. A straight line rises by equal steps over equal times, so the count is multiplied by the same factor each year: exponential growth.
- Correct: It grows exponentially, by the same factor in equal times: Straight on a semi-log plot means is linear in , so is exponential.
- It grows linearly: equal time steps add the same number of users: Linear data would bend (concave down) on a log scale, because equal additions are smaller and smaller factors.
- It grows like a quadratic: its second differences are constant: A quadratic's logarithm is not linear in , so it would not make a straight line.
- It grows logarithmically: it rises by equal steps as doubles: Logarithmic growth would bend even more on a log scale.
2. From to , how does the number of users change?
- It is multiplied by
- It increases by users
- It is multiplied by
- It is multiplied by
Show the answer
is one labeled step (one power of ) above : from to , a factor of , over years.
- Correct: It is multiplied by : .
- It increases by users: The count goes from to , up ; on a log scale, equal steps are factors, not differences.
- It is multiplied by : is the number of years, not the factor.
- It is multiplied by : A factor of is two labeled steps, from to ; is one step above .
3. The line's slope is measured in powers of per year: the change in divided by the change in . What is the slope?
Show the answer
- Correct: : rises (two powers of ) in years.
- : That is , the slope on an ordinary scale; this axis shows .
- : is the factor over years, not the change in per year.
- : That is , the growth factor ; the slope is its logarithm, .
Table
The logarithm of
| 0 | 1 | 2 | 3 | 4 | |
|---|---|---|---|---|---|
| 0.5 | 0.8 | 1.1 | 1.4 | 1.7 |
4. What kind of function models ?
- is exponential in
- is linear in
- is logarithmic in
- is quadratic in
Show the answer
increases by for each step of in , so is linear in and is exponential.
- Correct: is exponential in : linear in means .
- is linear in : It is , not , that grows by equal amounts.
- is logarithmic in : A logarithmic would make itself change by equal steps over equal factors of .
- is quadratic in : has constant first differences, so it is linear, and is exponential.
5. Write as a linear function of .
Type an expression for .
Show the answer
The starting value at is and the constant change is per unit of : .
- Answer:
6. Which equation gives as a function of ?
Show the answer
, so
- Correct: : Undo the logarithm with base , then split the exponent.
- : That is , not .
- : The intercept and slope are logarithms of and , so and .
- : is a product of powers, not a sum.
7. Which function's graph is a straight line on a semi-log plot (logarithmic vertical axis)?
Show the answer
- Correct: : An exponential function becomes linear when you take its logarithm.
- : is not linear in ; the graph bends.
- : , which is not linear in .
- : is not linear in .
Part 9 · Summary
Summary
Part 10 · Up next
What comes next
Part 11 · Connections