Economic Growth
Long-run economic growth is a sustained rise in potential output and real GDP per capita.
Part 1 · Hook
Why this matters
Part 2 · Before you start
What this builds on
Part 3 · Prerequisite check
Quick check before you start
1. What does an outward shift of a PPC show?
- The economy can produce more of both goods
- The economy is using its resources less fully
- The opportunity cost of one good has risen
- Prices have risen
Show the answer
An outward shift means more production possibilities: more resources or better technology.
- Correct: The economy can produce more of both goods:
- The economy is using its resources less fully:
- The opportunity cost of one good has risen:
- Prices have risen:
2. What does the LRAS curve show?
- Full-employment output, which does not depend on the price level
- Total spending at each price level
- Output firms supply while wages are sticky
- The natural rate of unemployment
Show the answer
LRAS is vertical at potential output, set by resources and technology.
- Correct: Full-employment output, which does not depend on the price level:
- Total spending at each price level:
- Output firms supply while wages are sticky:
- The natural rate of unemployment:
Part 4 · See it
See it first
Part 5 · Step by step
How it works, step by step
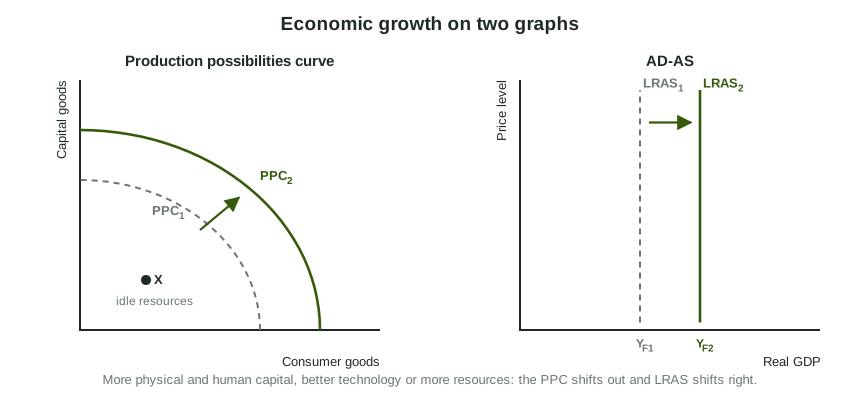
- Firms invest in equipment, workers gain skills, technology improvesproductivity (output per worker) rises
- Productivity risespotential output rises
- Potential output risesLRAS shifts right and the PPC shifts out
- Output grows faster than populationreal GDP per capita, the average standard of living, rises
Part 6 · Key ideas
Key ideas
- Economic growth is a sustained rise in potential output and real GDP per capita, shown by the PPC shifting out and LRAS shifting right.
- Its sources: more physical capital (machines, buildings), more human capital (skills, education, health), better technology, and more or better natural resources and labor.
- Productivity, output per worker, is what lets living standards keep rising; per capita growth is roughly output growth minus population growth.
- Choosing more capital goods today costs consumer goods now but shifts the PPC out further later. Moving from inside the PPC to the curve is recovery, not growth.
Part 7 · Misconception
A common mistake
The wrong idea: Moving from a point inside the PPC to a point on it is economic growth.
What actually happens: That is recovery: idle workers and factories go back to work. Economic growth is the PPC itself shifting out (and LRAS shifting right), because the economy can produce more than before.
Part 8 · Check yourself
Check yourself
Exam-style questions. Anything you miss goes into your review queue.
1. What do economists mean by long-run economic growth?
- A rise in nominal GDP from one year to the next
- A recovery from a recession, back to full-employment output and jobs
- A sustained rise in real GDP per capita as capacity grows
- A rise in the price level caused by strong demand
Show the answer
Economic growth: the PPC shifts out and LRAS shifts right, so real GDP per capita can rise year after year.
- A rise in nominal GDP from one year to the next: Nominal GDP can rise just because prices rise; growth is measured in real terms.
- A recovery from a recession, back to full-employment output and jobs: Moving back to full employment uses idle resources; it does not raise capacity.
- Correct: A sustained rise in real GDP per capita as capacity grows: Right: growth is an increase in potential output (and output per person) over many years.
- A rise in the price level caused by strong demand: A higher price level is inflation, not growth.
Data
Output and population in three invented countries
| Country | Real GDP, Year 1 | Real GDP, Year 2 | Population, Year 1 | Population, Year 2 |
|---|---|---|---|---|
| Alton | 400 | 440 | 20 | 20 |
| Breck | 300 | 330 | 30 | 33 |
| Corin | 200 | 210 | 10 | 10 |
2. What is the growth rate of Alton's real GDP from Year 1 to Year 2?
Type a number (%). A four-function calculator is allowed, as on the exam.
Show the answer
- Answer: 10 %
3. What is the growth rate of Corin's real GDP per capita from Year 1 to Year 2?
Type a number (%). A four-function calculator is allowed, as on the exam.
Show the answer
Real GDP per capita goes from to thousand dollars, a growth rate of percent.
- Answer: 5 %
4. In which country did the average standard of living, measured by real GDP per capita, not rise?
- Alton
- Breck
- Corin
- Alton and Corin
Show the answer
Living standards follow real GDP per capita, not total real GDP.
- Alton: Alton's real GDP rose 10 percent with no change in population, so output per person rose.
- Correct: Breck: Right: real GDP and population both grew 10 percent, so real GDP per capita stayed at 10 thousand dollars.
- Corin: Corin's real GDP per capita rose from 20 to 21 thousand dollars.
- Alton and Corin: Output per person rose in both Alton and Corin.
5. A new technology raises productivity in both industries. Shift the PPC to show the effect.
Work on the graph (it needs JavaScript), then check.
Show the answer
Better technology lets the same resources produce more of both goods, so the PPC shifts out.
- Key: the production possibilities curve shifts out
6. An economy's real GDP rises 4 percent as it recovers from a recession. Over the same years, its full-employment output does not change. Is this economic growth?
- Yes: any rise in real GDP, for whatever reason, counts as economic growth
- No: idle resources went back to work; capacity did not rise
- Yes: real GDP per capita rose, so the PPC shifted out
- No: growth is counted when nominal GDP rises, not real GDP
Show the answer
Recovery moves the economy toward its PPC; growth shifts the PPC out.
- Yes: any rise in real GDP, for whatever reason, counts as economic growth: A rise in real GDP can be recovery; growth means capacity rises.
- Correct: No: idle resources went back to work; capacity did not rise: Right: on the PPC the economy moved from inside toward the curve; the curve did not shift out.
- Yes: real GDP per capita rose, so the PPC shifted out: Output per person can rise during a recovery while the PPC stays put.
- No: growth is counted when nominal GDP rises, not real GDP: Growth is measured in real terms, and a rise in nominal GDP alone could be inflation.
Part 9 · Summary
Summary
Part 10 · Up next
What comes next
Part 11 · Connections