
Knowing how many people live in a place is only a start. Planners also need to know who they are: how many are children, how many are working age and how many are older. The make-up of a population by age and sex is called its composition.
The population pyramid
A population pyramid is a bar graph that shows a population by age and sex. Males are on the left and females on the right. The youngest group is at the bottom and the oldest at the top. Each bar is usually a five-year age group, such as 0 to 4 or 20 to 24, given as a percent of the whole population or as a number of people.
Each bar is a cohort: a group of people born in the same years. As years pass, a cohort moves up the pyramid. The United States had a baby boom from 1946 to 1964; in a pyramid for 2020, those people form a wide band at ages 55 to 74.
Age structure is how a population is divided among age groups. Geographers often use three groups: children under 15, people of working age (15 to 64) and people 65 and over.
Three shapes
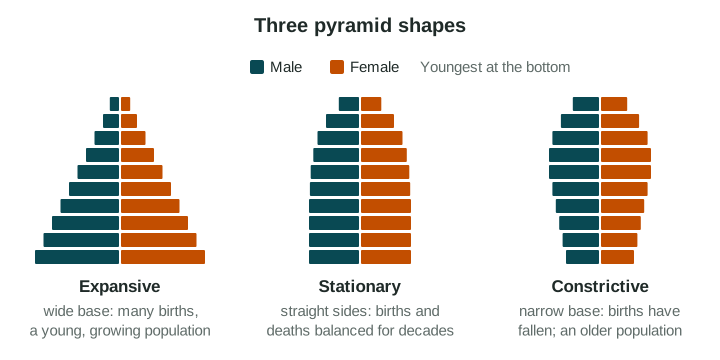
| Shape | What it looks like | What it suggests | Example |
|---|---|---|---|
| Expansive | Wide base, narrows quickly | Many births; a young, growing population | Niger: nearly half of the people under 15 (UN WPP 2024, 2023 estimates) |
| Stationary | Nearly straight sides until old age | Births and deaths roughly balanced for decades | Sweden in recent decades |
| Constrictive | Base narrower than the middle | Births have fallen; the population is getting older | Japan, where more than a quarter of people were 65 or older (Statistics Bureau of Japan, 2023) |
Read the shape for the future. A wide base means many children who will need schools now and jobs later. A narrow base and a wide middle mean fewer workers in the future and more people reaching retirement.
The sex ratio
The sex ratio is the number of males for every 100 females. Compare the left and right bars at each age.
Worked example. An invented country has 52 million males and 48 million females. Sex ratio = 52 ÷ 48 × 100 ≈ 108 males per 100 females. Males always go on top.
About 105 boys are born for every 100 girls in most countries. At older ages women outnumber men, because women on average live longer. Some places break these patterns:
- In China, the sex ratio at birth rose well above 105 in the 2000s (National Bureau of Statistics of China), linked to a preference for sons when families had only one child.
- In Qatar, men aged 25 to 44 far outnumber women (Qatar census, 2020), because many men from other countries come to work there.
Bulges, dents and scale
A pyramid records history. A bulge can show a baby boom; a dent can show a war, a famine or a time when many people left. A bulge of working-age men can show workers who moved in.
The pattern also depends on the scale of analysis. At the national scale, the United States has a fairly even pyramid. At the local scale:
- A college town such as State College, Pennsylvania, has a huge bulge at ages 18 to 24.
- A retirement town in Florida is widest at ages 65 to 79 and narrow at the base.
- A city neighborhood full of new apartments may be full of young adults.
A national pyramid cannot show these differences. It also cannot show why a pattern formed, or where in the country each group lives. Those questions need other data, at other scales.
Why composition matters
Composition tells governments what to plan for: schools and jobs for a young population, health care and pensions for an older one. The next topic looks at what changes a population over time: births, deaths and migration.