Energy Diagrams
An energy diagram shows reactants and products at their enthalpy levels.
Part 1 · Hook
Why this matters
Part 2 · Before you start
What this builds on
Part 3 · Prerequisite check
Quick check before you start
1. On a reaction energy profile, what is the activation energy?
- The climb from the reactants to the top of the hump
- The drop from the hump to the products
- The difference between reactants and products
- The height of the products above the axis
Show the answer
Ea is the minimum energy the colliding particles need: the climb from the reactant level to the transition state.
- Correct: The climb from the reactants to the top of the hump:
- The drop from the hump to the products:
- The difference between reactants and products:
- The height of the products above the axis:
2. In an exothermic process, energy moves
- from the system to the surroundings
- from the surroundings to the system
- in neither direction
- only as light
Show the answer
Exothermic means energy leaves the system, so ΔH is negative.
- Correct: from the system to the surroundings:
- from the surroundings to the system:
- in neither direction:
- only as light:
Part 4 · See it
See it first
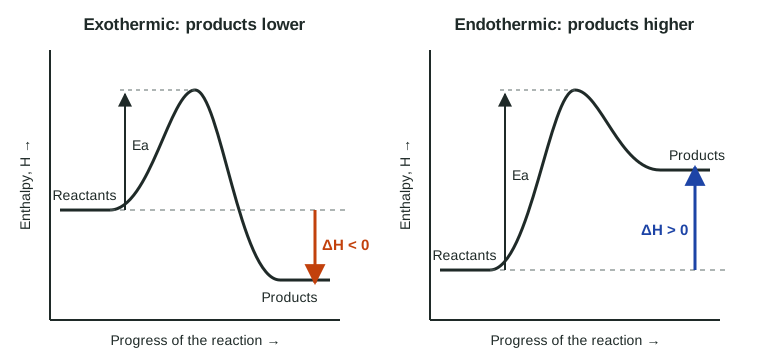
Part 5 · Step by step
How it works, step by step
- Each substance has an enthalpy set by its bonds and attractionsreactants and products sit at definite levels on the diagram
- ΔH = H(products) − H(reactants)products below reactants give a negative ΔH (exothermic); products above give a positive ΔH (endothermic)
- Bonds must partly break before new ones forma hump between the levels marks the activation energy
- Running the reaction backward reads the same diagram right to leftΔH flips sign and the activation energy is measured from the other side
Part 6 · Key ideas
Key ideas
- An energy diagram plots enthalpy against the progress of the reaction.
- ΔH = H(products) − H(reactants): products lower means exothermic (ΔH < 0); products higher means endothermic (ΔH > 0).
- The hump gives the activation energy, the climb from the starting level to the top. It controls speed, not ΔH.
- Reverse reaction: same picture read backward; ΔH changes sign and Ea(reverse) = Ea(forward) − ΔH.
- A catalyst lowers the hump and leaves both end levels, and ΔH, unchanged.
Part 7 · Misconception
A common mistake
The wrong idea: A reaction with a tall hump must be endothermic, because it takes a lot of energy.
What actually happens: The hump is the activation energy. Whether a reaction is endothermic depends only on whether the products end above the reactants.
Part 8 · Check yourself
Check yourself
Exam-style questions. Anything you miss goes into your review queue.
Graph
Energy diagram for a gas-phase reaction
The diagram shows the enthalpy of a reacting system as the reaction X(g) + Y(g) → Z(g) proceeds, per mole of reaction. The three marked levels are: reactants 125 kJ, top of the hump 214 kJ, products 38 kJ.
Data table
| Progress of the reaction | X + Y → Z |
|---|---|
| 0 | 125 |
| 1 | 125 |
| 2 | 150 |
| 3 | 200 |
| 3.5 | 214 |
| 4 | 200 |
| 5 | 110 |
| 6 | 50 |
| 6.5 | 38 |
| 8 | 38 |
1. Use the diagram to determine ΔH for the reaction X + Y → Z, in kJ/mol.
Type a number and its unit.
Show the answer
ΔH = H(products) − H(reactants) = 38 kJ − 125 kJ = −87 kJ per mole of reaction. Products sit below reactants, so the sign is negative.
- Answer: -87 kJ/mol
2. Use the diagram to determine the activation energy of the forward reaction, in kJ/mol.
Type a number and its unit.
Show the answer
Ea(forward) = H(peak) − H(reactants) = 214 kJ − 125 kJ = 89 kJ/mol.
- Answer: 89 kJ/mol
3. Which statement about the reverse reaction, Z → X + Y, is supported by the diagram?
- It is exothermic, with ΔH = −87 kJ/mol and an activation energy of 89 kJ/mol.
- It is endothermic, with ΔH = +87 kJ/mol and an activation energy of 89 kJ/mol.
- It is endothermic, with ΔH = +87 kJ/mol and an activation energy of 176 kJ/mol.
- It is endothermic, with ΔH = +87 kJ/mol and an activation energy of zero.
Show the answer
For the reverse reaction, ΔH = 125 − 38 = +87 kJ/mol and Ea(reverse) = 214 − 38 = 176 kJ/mol. The diagram is read right to left.
- It is exothermic, with ΔH = −87 kJ/mol and an activation energy of 89 kJ/mol.: This copies the forward values. Reversing the direction flips the sign of ΔH and changes which side the climb starts from.
- It is endothermic, with ΔH = +87 kJ/mol and an activation energy of 89 kJ/mol.: The sign is right, but the reverse climb starts at the products, 38 kJ, not at the reactants.
- Correct: It is endothermic, with ΔH = +87 kJ/mol and an activation energy of 176 kJ/mol.: Right: going backward climbs from 38 kJ to 214 kJ, then ends at 125 kJ, higher than it started.
- It is endothermic, with ΔH = +87 kJ/mol and an activation energy of zero.: The reverse reaction passes over the same hump; climbing it from 38 kJ to 214 kJ takes 176 kJ/mol.
4. A catalyst is added to the reaction mixture. How does the diagram change?
- The peak is lower, and the products move down, so ΔH becomes more negative.
- The peak stays the same, and the products move down, so more energy is released.
- The peak is higher, so the reaction absorbs extra energy and ΔH becomes positive.
- The peak is lower; the reactant and product levels, and so ΔH, stay the same.
Show the answer
ΔH depends only on where the reactants and products sit. A catalyst lowers the hump between them.
- The peak is lower, and the products move down, so ΔH becomes more negative.: The products are the same substances, so their enthalpy is unchanged.
- The peak stays the same, and the products move down, so more energy is released.: A catalyst changes the path, which is the peak, not the end points.
- The peak is higher, so the reaction absorbs extra energy and ΔH becomes positive.: A catalyst lowers the activation energy; it does not raise it, and it does not change ΔH.
- Correct: The peak is lower; the reactant and product levels, and so ΔH, stay the same.: Right: a catalyst offers a path with a lower activation energy but starts and ends at the same substances.
5. A diagram for the reaction 2 H₂O₂(aq) → 2 H₂O(l) + O₂(g), which warms the solution, is drawn by a student with the products higher than the reactants. What is wrong?
- The products belong at the same level as the reactants, because atoms are conserved.
- A reaction that warms its surroundings releases energy, so its products belong below the reactants.
- Nothing is wrong, because a reaction that warms its surroundings gains enthalpy.
- The hump is missing, because a reaction that releases energy has no activation energy.
Show the answer
The diagram shows the system. An exothermic system ends with less enthalpy, so the products sit below the reactants.
- The products belong at the same level as the reactants, because atoms are conserved.: Atoms are conserved, but energy is not stored the same way in different bonds; the levels differ.
- Correct: A reaction that warms its surroundings releases energy, so its products belong below the reactants.: Right: warming the solution means the system lost energy, so ΔH < 0 and the products sit lower.
- Nothing is wrong, because a reaction that warms its surroundings gains enthalpy.: The surroundings gain energy; the system, whose enthalpy is drawn, loses it.
- The hump is missing, because a reaction that releases energy has no activation energy.: The student's hump is not the issue, and exothermic reactions do have activation energies.
6. Which energy diagram matches an endothermic reaction that is fast at room temperature?
- Products well below the reactants, with a small hump
- Products a little above the reactants, with a very tall hump
- Products a little above the reactants, with a small hump
- Products level with the reactants, with no hump
Show the answer
Two separate readings: the end levels give the sign of ΔH; the hump gives the activation energy, which governs speed (5.6).
- Products well below the reactants, with a small hump: A small hump fits a fast reaction, but products below reactants make it exothermic.
- Products a little above the reactants, with a very tall hump: Endothermic is right, but a tall hump means a large Ea and a slow reaction.
- Correct: Products a little above the reactants, with a small hump: Right: products above reactants means endothermic; a small hump means a small Ea and a fast reaction.
- Products level with the reactants, with no hump: Level ends give ΔH = 0, and a reaction that rearranges bonds has a hump.
7. Methane burns in oxygen with ΔH = −890 kJ/mol, yet a gas stove does not light until a spark is applied. Which energy diagram explains both facts?
- Products far below reactants, with a hump that the spark helps the molecules climb
- Products far above reactants, so the spark supplies the extra energy stored in the products
- Products far below reactants, with no hump, so the spark is not really needed
- Products level with reactants, with a hump that the spark climbs
Show the answer
ΔH (end levels) tells how much energy is released; Ea (the hump) tells whether molecules have enough energy to start. Once burning, the energy released keeps lighting new molecules.
- Correct: Products far below reactants, with a hump that the spark helps the molecules climb: Right: the low products make it strongly exothermic; the hump (Ea) is why it needs a start.
- Products far above reactants, so the spark supplies the extra energy stored in the products: A ΔH of −890 kJ/mol means the products are far below the reactants.
- Products far below reactants, with no hump, so the spark is not really needed: Without a hump, methane would burn the moment it met air; the spark is needed.
- Products level with reactants, with a hump that the spark climbs: Level ends would mean ΔH = 0, not −890 kJ/mol.
Part 9 · Summary
Summary
Part 10 · Up next
What comes next
Part 11 · Connections