Tabular Representation and Summary Statistics for One Categorical Variable
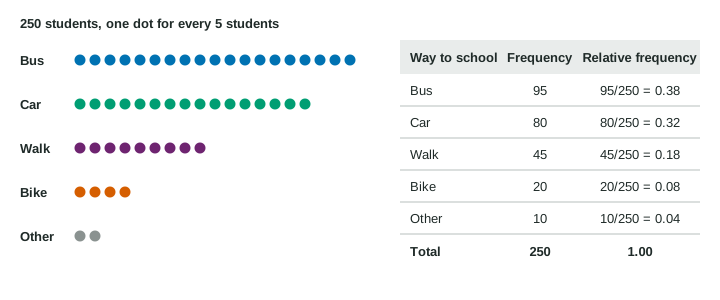
A frequency table counts each category; a relative frequency divides each count by the total, so relative frequencies are between 0 and 1, add to 1, and compare groups of different sizes.
Part 1 · Hook
Why this matters
Part 2 · Before you start
What this builds on
Part 3 · Prerequisite check
Quick check before you start
1. What is 40 out of 160 as a decimal?
- 0.25
- 0.4
- 4
- 0.04
Show the answer
Part over whole: 40/160 = 0.25.
- Correct: 0.25:
- 0.4:
- 4:
- 0.04:
2. A survey records each adult’s main news source. What kind of variable is that?
- Categorical
- Quantitative and discrete
- Quantitative and continuous
- A statistic
Show the answer
Each adult is placed in a group (a source), so the variable is categorical.
- Correct: Categorical:
- Quantitative and discrete:
- Quantitative and continuous:
- A statistic:
Part 4 · See it
See it first
Part 5 · Step by step
How it works, step by step
- Each individual falls in one category of a categorical variablecounting each category gives a frequency table
- Divide each count by the totalthe relative frequencies are parts of the whole, between 0 and 1, and they add to 1
- Relative frequencies all divide by their own totalssamples of different sizes can be compared fairly
- The relative frequency of a category in a sample is it is a statistic that estimates p, the proportion in the whole population
Part 6 · Key ideas
Key ideas
- A frequency table lists each category of a categorical variable and its count (frequency).
- A relative frequency is a count divided by the total. Relative frequencies are between 0 and 1 and add to 1 when categories do not overlap.
- Count = relative frequency × total, so a relative frequency table needs the total to get back to counts.
- The sample proportion is the relative frequency of a category in a sample, a statistic. The population proportion is the same quantity for the whole population, a parameter.
Part 7 · Misconception
A common mistake
The wrong idea: The second city has 130 television viewers against 40, so a larger share of its adults watch television.
What actually happens: Compare relative frequencies: and . The shares are almost the same; the second sample is simply bigger.
Part 8 · Check yourself
Check yourself
Exam-style questions. Anything you miss goes into your review queue.
Table
Where adults get their news
| News source | Frequency |
|---|---|
| Social media | 56 |
| Television | 40 |
| News websites | 36 |
| Radio | 16 |
| Print newspaper | 12 |
| Total | 160 |
1. What is the relative frequency of adults whose main source is television?
Type a number. A table answer and a calculator answer are both accepted.
Show the answer
: a quarter of the sampled adults get their news mainly from television.
- Answer: 0.25
2. What proportion of the sampled adults get their news mainly from social media or television?
Type a number. A table answer and a calculator answer are both accepted.
Show the answer
- Answer: 0.6
3. Which statement about the relative frequencies of the five news sources is true?
- They add to 160, the number of adults who were asked
- They add to 1, because each adult is in exactly one category
- They are equal to one another, since each adult chose a single source
- They add to 100, because each one is a percent of the sample
Show the answer
When categories do not overlap and cover everyone, the relative frequencies add to 1 (or 100%).
- They add to 160, the number of adults who were asked: The frequencies add to 160. Each relative frequency is a count over 160, so together they add to 1.
- Correct: They add to 1, because each adult is in exactly one category: Right: every adult chose one main source, so the five parts make up the whole sample.
- They are equal to one another, since each adult chose a single source: Each adult chose one source, but the sources were chosen different numbers of times.
- They add to 100, because each one is a percent of the sample: As percents they add to 100%. As relative frequencies (decimals) they add to 1.
4. For print newspapers, . What does describe?
- The city’s adults, as a population proportion
- The 12 adults
- The news sources that the city’s adults can choose from
- The 160 adults in the sample
Show the answer
A sample proportion is the part of the sample in a category. It is a statistic, used to estimate the population proportion p.
- The city’s adults, as a population proportion: That would be p, the population proportion, which is unknown here.
- The 12 adults: The 12 are the part; compares them with the whole sample of 160.
- The news sources that the city’s adults can choose from: The sources are the categories; is a number about adults in one category.
- Correct: The 160 adults in the sample: Right: is a sample proportion, a statistic. It estimates p for the city.
5. A gym asked 60 members which class they like best: 12 chose yoga, 18 chose cycling and 30 chose weights. What is the relative frequency of cycling?
Type a number. A table answer and a calculator answer are both accepted.
Show the answer
, so 30% of the members asked chose cycling.
- Answer: 0.3
6. A survey asked 200 students, "Which of these apps do you use? Check every one you use." The relative frequencies add to 1.85. What explains this?
- Someone added the relative frequencies incorrectly
- The survey asked more students than it reported in the total
- Students could check more than one app, so categories overlap
- Relative frequencies are supposed to add to 2 for a survey
Show the answer
Relative frequencies add to 1 only when each individual falls in exactly one category. With "check every one", students fall in several.
- Someone added the relative frequencies incorrectly: The sum is correct; it is over 1 because the categories overlap.
- The survey asked more students than it reported in the total: The total is 200; overlap explains the sum.
- Correct: Students could check more than one app, so categories overlap: Right: one student can be counted in several categories, so the parts add to more than the whole.
- Relative frequencies are supposed to add to 2 for a survey: They add to 1 only when each individual is in exactly one category.
Part 9 · Summary
Summary
Part 10 · Up next
What comes next
Part 11 · Connections