Introducing Statistics: What Can We Learn from Data?
Statistics answers questions about a population, the whole group of interest, using data from a sample, the part you actually measure.
Part 1 · Hook
Why this matters
Part 2 · See it
See it first
Part 3 · Step by step
How it works, step by step
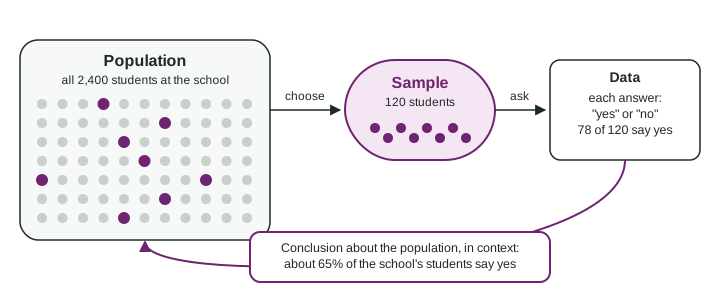
- The question is about a large group, the populationasking everyone would take too long and cost too much
- So you collect data from a sample, a smaller part of the populationthe answers vary from person to person, so you summarize them: 78 of 120 is 65%
- The summary describes the sampleit is a good estimate for the population only if the sample represents the population
- A different sample would give a slightly different resultso a conclusion about the population is an estimate, stated in context, never a certainty
Part 4 · Key ideas
Key ideas
- Statistics is the science of collecting, summarizing and reading data to answer questions whose answers vary.
- The population is the whole group a question is about. The sample is the part of it that data come from.
- A study uses data from a sample to answer a question about a population. It works only if the sample represents the population.
- State every result in context: who was studied, what was measured, and what the number tells you.
- Another sample gives a slightly different result, so a sample result is an estimate for the population, not its exact value.
Part 5 · Misconception
A common mistake
The wrong idea: 78 of the 120 students said yes, so exactly 65% of all 2,400 students would use the room.
What actually happens: The 65% describes the sample. It estimates the school’s percent, and another random sample of 120 would give a slightly different number.
Part 6 · Check yourself
Check yourself
Exam-style questions. Anything you miss goes into your review queue.
Table
A study room at lunch
A high school has 2,400 students. The student council wants to know whether students would use a quiet study room at lunch. The council chooses 120 students at random from the school list and asks each one, "Would you use a quiet study room at lunch once a week or more?" Of the 120 students, 78 answer yes (invented data).
1. What is the population in this study?
- The 120 students asked
- All 2,400 students at the school
- The 78 students who answered yes to the question
- Students who already study in the library at lunch
Show the answer
The population is the whole group the question is about: all 2,400 students at the school.
- The 120 students asked: These 120 are the sample: the part of the population the council actually asked.
- Correct: All 2,400 students at the school: Right: the question is about every student at the school, so the whole school is the population.
- The 78 students who answered yes to the question: The 78 are a count inside the sample, not the group the question is about.
- Students who already study in the library at lunch: The question is about every student, not just those who already use a study space.
2. What is the sample in this study?
- The 2,400 students enrolled at the high school
- The 78 who said yes
- The members of the student council who ran the study
- The 120 students the council asked
Show the answer
The sample is the part of the population that data come from: the 120 students who were asked.
- The 2,400 students enrolled at the high school: That is the population, the whole group the question is about.
- The 78 who said yes: They are part of the sample, but the sample is everyone who was asked, yes or no.
- The members of the student council who ran the study: The council ran the study; they are not the students who were asked.
- Correct: The 120 students the council asked: Right: the sample is the group data were actually collected from.
3. Which statement correctly uses the data?
- 65% of the students asked said yes
- Exactly 65% of the school’s 2,400 students would use the room
- 78% of the school would use it
- Exactly 78 students at the school would use the study room
Show the answer
The 78 yes answers are 78 out of 120, which is 65% of the sample. That is a fact about the sample and an estimate for the school.
- Correct: 65% of the students asked said yes: Right: 78 out of 120 is 0.65, and it describes the students who were asked.
- Exactly 65% of the school’s 2,400 students would use the room: The 65% describes the sample. A different sample would give a slightly different number, so it is not exact for the whole school.
- 78% of the school would use it: 78 is the count of yes answers, not a percent: 78 out of 120 is 65%.
- Exactly 78 students at the school would use the study room: Just 120 of the 2,400 students were asked; far more than 78 students at the school could want the room.
4. A second group of 120 students is chosen at random from the same school list and asked the same question. What is most likely?
- Exactly 78 yes answers again
- A percent very far from 65%, since each group is chosen by chance
- A percent near 65%, but probably not exactly 65%
- Exactly 65% of the 120, because the method of choosing is the same
Show the answer
Different students give different answers, so a new group of 120 gives a result that varies a little from the first one but is usually close to it.
- Exactly 78 yes answers again: Different students are chosen each time, so the count changes from group to group even when the school stays the same.
- A percent very far from 65%, since each group is chosen by chance: Groups chosen by chance from the same school tend to give similar results; a huge change would be surprising.
- Correct: A percent near 65%, but probably not exactly 65%: Right: answers vary from student to student, so each group of 120 gives a somewhat different percent, usually close to the first.
- Exactly 65% of the 120, because the method of choosing is the same: The method is the same, but the students are different, so the result usually shifts a little.
5. Which question is answered by collecting data that vary from one person to another?
- How long do students here spend on homework on a typical night?
- How many minutes did I spend on my own homework last night?
- How many minutes long is the lunch period at this school?
- How many students are enrolled at this school this year?
Show the answer
Statistics answers questions where the answers vary, so the data must come from many individuals.
- Correct: How long do students here spend on homework on a typical night?: Right: homework time differs from student to student, so it takes data from many students to answer.
- How many minutes did I spend on my own homework last night?: That is one number about one person; there is no variation to study.
- How many minutes long is the lunch period at this school?: The lunch period has one fixed length; looking it up answers the question.
- How many students are enrolled at this school this year?: That is one fixed number from the school records, not data that vary.
6. A park department asks 300 park visitors whether they want more shade trees; 210 say yes. Which conclusion is stated in context?
- The answer is 70%
- Most of the people who answered the question want more of it
- 210 is greater than 300 divided by 2, so the result is a majority
- 70% of the 300 visitors asked want more shade trees
Show the answer
A conclusion in context names who was studied, what was measured, and what the number tells you: 210 out of 300 is 70% of the visitors surveyed.
- The answer is 70%: A number with no context does not say who, or what the 70% measures.
- Most of the people who answered the question want more of it: This does not name the people, the park or the trees.
- 210 is greater than 300 divided by 2, so the result is a majority: True arithmetic, but it says nothing about the visitors or the trees.
- Correct: 70% of the 300 visitors asked want more shade trees: Right: it says who was asked, what about, and the number: 210 out of 300 is 70%.
Part 7 · Summary
Summary
Part 8 · Up next
What comes next
Part 9 · Connections