The Normal Curve and Percentiles
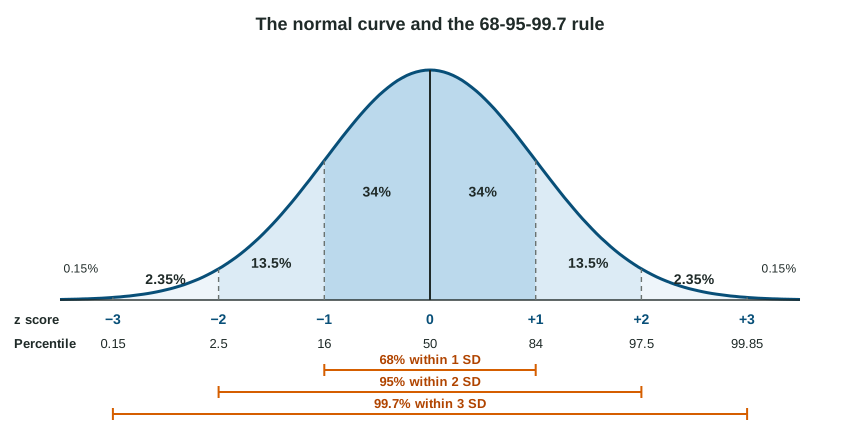
In a normal distribution, scores form a symmetric bell curve around the mean.
Part 1 · Hook
Why this matters
Part 2 · Before you start
What this builds on
Part 3 · Prerequisite check
Quick check before you start
1. A test has a mean of 75 and a standard deviation of 15. What does the standard deviation describe?
- How spread out the scores are around the mean
- The most common score on the test
- The middle score when they are put in order
- The difference between the highest and lowest scores
Show the answer
The standard deviation is roughly the typical distance of scores from the mean.
- Correct: How spread out the scores are around the mean:
- The most common score on the test:
- The middle score when they are put in order:
- The difference between the highest and lowest scores:
2. What is the mean of 6, 8 and 10?
- 8
- 24
- 6
- 10
Show the answer
The total is 24, and 24 divided by 3 values is 8.
- Correct: 8:
- 24:
- 6:
- 10:
Part 4 · See it
See it first
Part 5 · Step by step
How it works, step by step
- Many traits and test scores are shaped by many small influencestheir frequency distribution is bell-shaped and symmetric: the normal curve
- Mark the mean and each standard deviation on the curvethe 68-95-99.7 rule gives the share of scores between the marks
- Subtract the mean from a score and divide by the standard deviationthe z score says how many standard deviations the score is from the mean
- Add up the share of scores below a markthe percentile rank: 50 at the mean, 84 at one SD above, 16 at one SD below
Part 6 · Key ideas
Key ideas
- A normal curve is symmetric and bell-shaped: mean, median and mode are equal, in the middle.
- The 68-95-99.7 rule: about 68% of scores lie within 1 standard deviation of the mean, 95% within 2 and 99.7% within 3. Bands: 34%, 13.5%, 2.35% on each side.
- A z score: . Above the mean, positive; below, negative.
- A percentile rank is the percent of scores below a score, not the percent correct. One SD above the mean is the 84th percentile.
Part 7 · Misconception
A common mistake
The wrong idea: The 90th percentile means getting 90% of the questions right, and 68% means a score at the 68th percentile.
What actually happens: A percentile is a rank among test takers: the 90th percentile beats about 90% of them, whatever the percent correct. 68% is the share of scores within one standard deviation on both sides, not a percentile.
Part 8 · Check yourself
Check yourself
Exam-style questions. Anything you miss goes into your review queue.
1. Scores on a memory test are normally distributed with a mean of 50 and a standard deviation of 10. What is the z score of a student who scored 70?
Type a number. No calculator needed: work it out by hand, as on the exam.
Show the answer
- Answer: 2
2. In a normal distribution, what percent of scores fall more than one standard deviation above the mean?
Type a number (%). No calculator needed: work it out by hand, as on the exam.
Show the answer
Half the scores are above the mean (50%), and 34% are between the mean and . So are above .
- Answer: 16 %
3. Maya scored at the 90th percentile on a reading test. What does that mean?
- She scored higher than about 90% of test takers
- She answered about 90% of the test questions correctly
- Her score is 90 points above the mean
- She is in the top 90% of the test takers
Show the answer
A percentile rank is the percent of scores that fall below a given score. Percent correct is a different number.
- Correct: She scored higher than about 90% of test takers: Right: a percentile rank is the percent of scores below hers.
- She answered about 90% of the test questions correctly: Percentile is about rank among test takers, not the percent correct.
- Her score is 90 points above the mean: A percentile is a rank, not a distance in points.
- She is in the top 90% of the test takers: The top 90% would include nearly everyone; she is in the top 10%.
Figure
A normal curve of test scores
4. By the 68-95-99.7 rule, what percent of test takers scored between 85 and 115?
Type a number (%). No calculator needed: work it out by hand, as on the exam.
Show the answer
85 and 115 are one standard deviation below and above the mean of 100: .
- Answer: 68 %
5. What percent of test takers scored above 130?
Type a number (%). No calculator needed: work it out by hand, as on the exam.
Show the answer
130 is two standard deviations above the mean. Above it: .
- Answer: 2.5 %
6. About what percentile rank does a score of 115 have?
- The 34th percentile
- The 68th percentile
- The 84th percentile
- The 115th percentile
Show the answer
Percentile rank is the percent of scores below a score: .
- The 34th percentile: 34% is the band from 100 to 115, not the percent below 115.
- The 68th percentile: 68% lies between 85 and 115; it is not the percent below 115.
- Correct: The 84th percentile: Right: 50% below the mean plus 34% from 100 to 115.
- The 115th percentile: Percentile ranks run from 0 to 100; 115 is the score.
Part 9 · Summary
Summary
Part 10 · Up next
What comes next
Part 11 · Connections