Correlation and Scatterplots
A correlation describes how two variables are related.
Part 1 · Hook
Why this matters
Part 2 · Before you start
What this builds on
Part 3 · Prerequisite check
Quick check before you start
1. A researcher records hours of sleep and grades for 200 students, without changing anything. What can she conclude?
- Whether sleep and grades are related, but not whether one causes the other
- That more sleep causes better grades
- That better grades cause more sleep
- Nothing, because no one was randomly sampled
Show the answer
This is a correlational study: it shows whether variables are related, not cause and effect.
- Correct: Whether sleep and grades are related, but not whether one causes the other:
- That more sleep causes better grades:
- That better grades cause more sleep:
- Nothing, because no one was randomly sampled:
2. What is a third variable?
- An outside variable that affects both of two related variables
- The variable a researcher manipulates in an experiment
- The variable that is measured in an experiment
- A variable that appears in only one of the groups
Show the answer
A third variable can create a relationship between two variables that do not affect each other.
- Correct: An outside variable that affects both of two related variables:
- The variable a researcher manipulates in an experiment:
- The variable that is measured in an experiment:
- A variable that appears in only one of the groups:
Part 4 · See it
See it first
Part 5 · Step by step
How it works, step by step
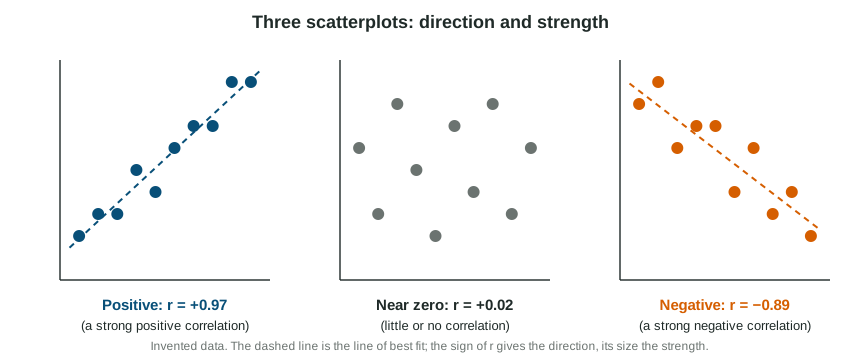
- Two variables are measured for the same people and plotted as pointsa scatterplot shows whether they rise together, move in opposite directions or show no pattern
- The correlation coefficient r summarizes the patternits sign gives the direction and its size, from 0 to 1, gives the strength
- Nothing was manipulated or randomly assigneda third variable or the reverse direction may explain the relationship, so no cause can be claimed
Part 6 · Key ideas
Key ideas
- The correlation coefficient runs from to . The sign is the direction; the size (ignoring the sign) is the strength. is stronger than .
- A positive correlation: both variables rise and fall together. A negative correlation: as one rises, the other tends to fall.
- A scatterplot shows each person as a point; the line of best fit shows the trend and allows prediction.
- Correlation is not causation: a third variable or the directionality problem can explain it. An illusory correlation is a relationship people believe in that the data do not show.
Part 7 · Misconception
A common mistake
The wrong idea: A negative correlation means a weak or bad relationship, and a strong correlation proves cause and effect.
What actually happens: Negative only means the variables move in opposite directions: is very strong. And no correlation, however strong, shows cause without an experiment.
Part 8 · Check yourself
Check yourself
Exam-style questions. Anything you miss goes into your review queue.
1. Which correlation coefficient shows the strongest relationship between two variables?
Show the answer
Strength is the size of r, ignoring the sign. A coefficient near -1 or +1 is strong; near 0 is weak.
- Correct: : Right: its size, 0.82, is the largest; the minus sign gives only the direction.
- : Its size, 0.45, is smaller than 0.82.
- : This is close to zero: a very weak relationship.
- : Its size, 0.30, is smaller than 0.82.
2. Across 50 towns, the more ice cream is sold in a month, the more drownings occur. Which explanation is most likely?
- Eating ice cream causes people to drown more often
- Hot weather raises both swimming and ice cream sales
- Drownings make the people of a town buy more ice cream
- The relationship is likely an illusory correlation
Show the answer
Two variables can move together because a third variable affects both. Hot months bring more swimming (and drownings) and more ice cream.
- Eating ice cream causes people to drown more often: A correlation does not show cause; a third variable explains this one.
- Correct: Hot weather raises both swimming and ice cream sales: Right: summer heat drives both.
- Drownings make the people of a town buy more ice cream: That reverses the direction, and it still ignores the obvious third variable.
- The relationship is likely an illusory correlation: An illusory correlation is a relationship people believe in that the data do not show; here the data show one.
3. Children who play violent video games more often are rated by teachers as more aggressive. Which is an example of the directionality problem in this finding?
- Already aggressive children may choose violent games more
- Parents’ supervision may affect both game time and aggression
- Teachers who rate the children may know about their games
- The children were not randomly sampled from the population of children
Show the answer
The directionality problem: in a correlation we cannot tell which of the two variables affects the other.
- Correct: Already aggressive children may choose violent games more: Right: aggression could lead to game choice, the reverse of the usual story.
- Parents’ supervision may affect both game time and aggression: That is a third variable, a separate problem from directionality.
- Teachers who rate the children may know about their games: That is a source of bias in the measure, not directionality.
- The children were not randomly sampled from the population of children: That limits generalizing; it is not about which variable came first.
Data
Hours studied and quiz scores
4. Which statement best describes the relationship in the scatterplot?
- A strong negative correlation
- A weak positive correlation
- A strong positive correlation
- No correlation between hours and scores
Show the answer
The points slope upward and cluster tightly around the line of best fit: strong and positive. For these invented data r = .88.
- A strong negative correlation: The points rise from left to right, so the correlation is positive.
- A weak positive correlation: The points sit close to the line, so the relationship is strong.
- Correct: A strong positive correlation: Right: scores rise with hours and the points lie close to the line (r = .88).
- No correlation between hours and scores: There is a clear upward pattern.
5. A teacher concludes from this plot that studying more causes higher quiz scores. What is the problem with that conclusion?
- The correlation is negative, so studying lowers scores
- The plot shows no relationship between hours and scores
- A scatterplot shows the cause, but this one has too few students
- The data are correlational; interest could raise both
Show the answer
The students chose how much to study, so this is a correlational study. Interest, prior knowledge or free time could affect both hours and scores. An experiment that randomly assigns study time would be needed to show cause.
- The correlation is negative, so studying lowers scores: The points rise from left to right: the correlation is positive.
- The plot shows no relationship between hours and scores: There is a clear, strong pattern.
- A scatterplot shows the cause, but this one has too few students: A scatterplot shows a relationship, never a cause, whatever its size.
- Correct: The data are correlational; interest could raise both: Right: a third variable, such as interest, could explain the pattern.
6. Using the line of best fit, about what score would you predict for a student who studied 4 hours?
- About 70
- About 55
- About 88
- About 4
Show the answer
The line of best fit passes near 70 at 4 hours. A correlation lets you predict one variable from the other, even though it does not show cause.
- Correct: About 70: Right: the line passes near 70 at 4 hours.
- About 55: That is near the line at 1 hour.
- About 88: That is near the line at 8 hours.
- About 4: That is the number of hours, not a score.
Part 9 · Summary
Summary
Part 10 · Up next
What comes next
Part 11 · Connections