Physics uses graphs constantly, and almost every graph question comes down to two moves: find the slope, or find the area under the graph. This page shows both, with the one habit that makes them easy: keep track of the units of each axis.
Axes: a quantity and a unit
Each axis shows one quantity, and its label must name both the quantity and its unit, as in "Time (s)" or "Height (m)". A label with only one of the two loses the point on the exam. By habit, the quantity you choose or control (the independent variable, often time) goes across, and the quantity that responds goes up.
Slope: rise over run
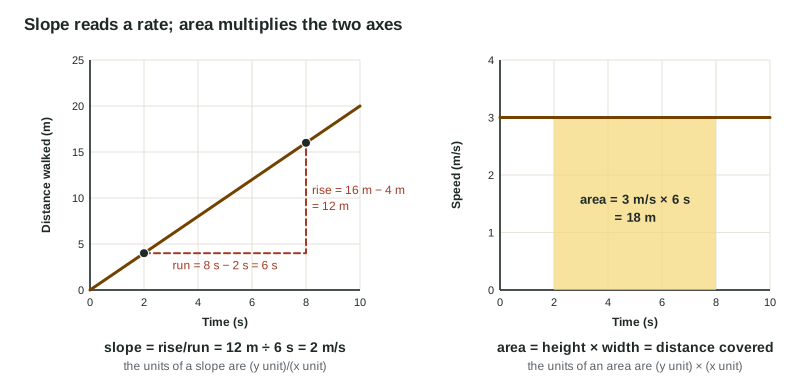
The slope of a straight line is how much y changes for each unit of x. Pick two points on the line, far apart, and divide:
slope = rise / run = Δy / Δx
The unit of a slope is (y unit)/(x unit). That is the key to its meaning. On a graph of distance (m) against time (s), the slope is in m/s, so it is a speed. On a graph of speed (m/s) against time (s), it is in m/s², a rate of change of speed.
Worked example 1. A line passes through (2 s, 4 m) and (8 s, 16 m) on a graph of distance against time. Find its slope.
rise = 16 m − 4 m = 12 m; run = 8 s − 2 s = 6 s.
slope = 12 m ÷ 6 s = 2 m/s. The walker covers 2 m every second.
A line that rises to the right has a positive slope; one that falls has a negative slope; a horizontal line has zero slope. A straight line has the same slope everywhere: a linear relationship, y = mx + b, where m is the slope and b is the vertical intercept (the value of y at x = 0).
A curved graph has a different steepness at each point. Its slope at one point is the slope of the straight line that just touches the curve there (a tangent line).
Area under a graph
The area under a graph is the region between the graph and the horizontal axis over some interval. Its unit is (y unit) × (x unit). On a graph of speed (m/s) against time (s), the area is in (m/s)(s) = m: a distance. That is why area matters: it turns a rate back into a total.
Worked example 2. Speed is a steady 3 m/s from t = 2 s to t = 8 s. What distance is covered?
The region is a rectangle 3 m/s tall and 6 s wide.
area = 3 m/s × 6 s = 18 m.
Break other shapes into rectangles and triangles. A triangle has area ½ × base × height: a speed rising steadily from 0 to 6.0 m/s over 3.0 s gives ½ × 3.0 s × 6.0 m/s = 9.0 m. Area that lies below the horizontal axis counts as negative.
| Slope | Area under the graph | |
|---|---|---|
| How | Δy ÷ Δx between two points on the line | height × width (rectangles), ½ × base × height (triangles) |
| Unit | (y unit)/(x unit) | (y unit) × (x unit) |
| Meaning | a rate: how fast y changes | a total: how much y × x builds up |
Real data: the best-fit line
Measured points never sit exactly on a line. Draw one straight best-fit line through them with about as many points above as below. Never connect the dots. Then find the slope from two points on your line, far apart, not from two data points. The line averages out the random scatter, so its slope uses all your measurements.
Linearizing a curve
Some relationships are not straight. A cart released from rest moves d = ½at², so a graph of d against t curves upward. The trick is to change what you plot. Compare d = (½a)(t²) with y = mx: if you put t² on the horizontal axis, the graph of d against t² is a straight line through the origin with slope ½a. This is linearization.
Worked example 3. A student plots d against t² and finds a best-fit slope of 0.45 m/s². Find a.
slope = ½a, so a = 2 × slope = 2 × 0.45 m/s² = 0.90 m/s².
Units check: the slope is m ÷ s² = m/s², an acceleration, as it should be.
The recipe: write the equation, match it to y = mx + b, choose y and x so that the rest is a constant slope, and say what the slope equals. The experimental design question on the exam asks for exactly this.