Slopes and Areas of Graphs
Label every axis with a quantity and unit.
Part 1 · Hook
Why this matters
Part 2 · Before you start
What this builds on
Part 3 · Prerequisite check
Quick check before you start
1. A walker covers 12 m in 6.0 s at a steady speed. What is her speed?
- 2.0 m/s
- 72 m/s
- 0.50 m/s
- 18 m/s
Show the answer
Speed = distance ÷ time = 12 m ÷ 6.0 s = 2.0 m/s.
- Correct: 2.0 m/s:
- 72 m/s:
- 0.50 m/s:
- 18 m/s:
2. If y ∝ x², what happens to y when x triples?
- It becomes 9 times as large
- It triples
- It becomes 6 times as large
- It becomes one ninth as large
Show the answer
The factor squared: 3² = 9.
- Correct: It becomes 9 times as large:
- It triples:
- It becomes 6 times as large:
- It becomes one ninth as large:
Part 4 · See it
See it first
Part 5 · Step by step
How it works, step by step
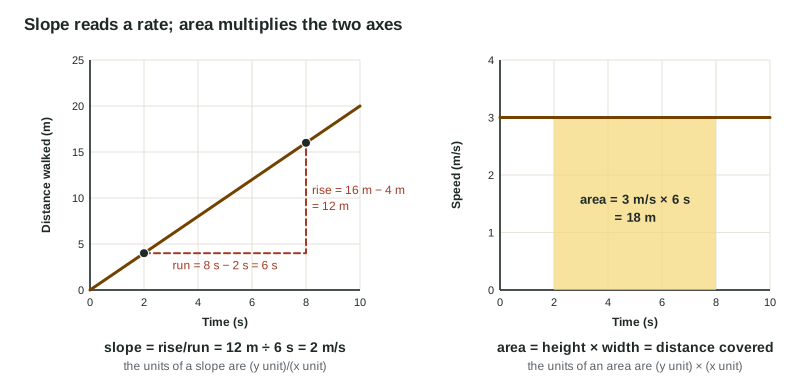
- A graph has a quantity with a unit on each axisits slope and its area each have a unit, built from those two units
- You divide the rise by the run between two points on a lineyou get the slope, the rate at which y changes per unit of x
- You multiply the height by the width of the region under a graphyou get an area whose unit is (y unit) × (x unit), often a total such as a distance
- Data scatter and the relationship may be curvedyou draw a best-fit line, after choosing what to plot so the graph is straight
Part 6 · Key ideas
Key ideas
- Every axis gets a label and a unit: "Time (s)". Without both, the graph cannot be read.
- Slope = rise/run = Δy/Δx, from two points on the line (not data points). Its unit is (y unit)/(x unit), and it is a rate.
- Area under a graph = height × width for a rectangle, ½ × base × height for a triangle. Its unit is (y unit) × (x unit).
- A best-fit line passes between scattered points, never dot to dot. If the relationship is curved, linearize: for d = ½at², plot d against t², and the slope is ½a.
Part 7 · Misconception
A common mistake
The wrong idea: To find a slope, divide the y-value of a point by its x-value, for example 9.0 m ÷ 10 s for a line through (0 s, 2.0 m) and (10 s, 9.0 m).
What actually happens: A slope uses changes between two points on the line: (9.0 m − 2.0 m) ÷ (10 s − 0 s) = 0.70 m/s. Dividing one point's values works only when the line passes through the origin.
Part 8 · Check yourself
Check yourself
Exam-style questions. Anything you miss goes into your review queue.
Graph
A rising weather balloon
A student tracks a small weather balloon just after release and records its height above the ground every 2 s. The line through the data is the best-fit line, height = 0.50 t + 1.2 (height in meters, t in seconds).
Measured heightBest-fit line
Data table
| Time (s) | Measured height | Best-fit line |
|---|---|---|
| 0 | 1.1 | 1.2 |
| 2 | 2.4 | — |
| 4 | 3.3 | — |
| 6 | 4 | — |
| 8 | 5 | — |
| 10 | 6.4 | 6.2 |
1. Using the best-fit line, what is the slope of the graph, with its unit?
Type a number and its unit.
Show the answer
Pick two points on the best-fit line, far apart, not data points: (0 s, 1.2 m) and (10 s, 6.2 m). Slope = rise/run = (6.2 m − 1.2 m) ÷ (10 s − 0 s) = 0.50 m/s.
- Answer: 0.50 m/s
2. What does the slope of this graph tell you about the balloon?
- The rate its height increases (m/s)
- How high it is at each moment of its flight
- How many seconds it takes to reach 6.2 m
- How high above the ground it started
Show the answer
A slope means "change in y per change in x". Here that is meters of height per second: the rate at which the balloon rises.
- Correct: The rate its height increases (m/s): Right: the slope is a change in height per change in time, so it is the balloon's upward speed.
- How high it is at each moment of its flight: Height at a moment is read straight off the graph, not from the slope.
- How many seconds it takes to reach 6.2 m: That is a time read from the horizontal axis, not a rate.
- How high above the ground it started: The starting height is the vertical intercept, 1.2 m.
3. What does the vertical intercept of the best-fit line, 1.2 m, represent?
- How fast the balloon rises
- The total height the balloon gained in 10 s
- The error in the height measurements made
- Its height when timing began
Show the answer
For a line y = mx + b, b is the value of y at x = 0. Timing started with the balloon already 1.2 m up.
- How fast the balloon rises: That is the slope, 0.50 m/s.
- The total height the balloon gained in 10 s: The gain is 6.2 m − 1.2 m = 5.0 m, a change, not the intercept.
- The error in the height measurements made: The intercept is a real starting value: the balloon was released from a height above the ground.
- Correct: Its height when timing began: Right: the intercept is the value of y when x is zero.
4. Why is the slope found from the best-fit line instead of from the first and last data points?
- The data points are not plotted on the graph
- Two data points are not enough to give a slope
- The line averages the scatter of all six points
- The best-fit line passes through each of the data points
Show the answer
Real data scatter. The first and last points here give (6.4 − 1.1) ÷ 10 = 0.53 m/s, while the best-fit line, which balances points above and below it, gives 0.50 m/s from all six measurements.
- The data points are not plotted on the graph: They are plotted; the issue is that each one carries some random error.
- Two data points are not enough to give a slope: Any two points give a slope, but two scattered points give a less reliable one than a line fit to all six.
- Correct: The line averages the scatter of all six points: Right: each point has some measurement error; the best-fit line uses all the data, so its slope is more reliable.
- The best-fit line passes through each of the data points: A best-fit line usually passes between points, with about as many above as below.
5. A graph has speed (m/s) on the vertical axis and time (s) on the horizontal axis. Which unit does the slope have, and which unit does the area under the line have?
- Slope: m; area: m/s²
- Slope: m/s; area: m/s
- Slope: s/m; area: m·s²
- Slope: m/s²; area: m
Show the answer
Slope units = (y unit)/(x unit); area units = (y unit) × (x unit).
- Slope: m; area: m/s²: These are swapped: a slope divides the units, an area multiplies them.
- Slope: m/s; area: m/s: The axis unit alone is neither; slope and area combine both axes' units.
- Slope: s/m; area: m·s²: Slope is y over x, not x over y, and an area multiplies y by x.
- Correct: Slope: m/s²; area: m: Right: slope = (m/s) ÷ s = m/s²; area = (m/s) × s = m.
6. A cart starts from rest with a steady acceleration, so d = ½at². A student wants a straight-line graph whose slope gives a. What should she plot?
- d against t; the slope is the acceleration a
- d against t²; the slope is ½a
- d against t²; the slope is twice the acceleration, 2a
- d² against t; the slope is half the acceleration
Show the answer
Linearize by matching y = mx: y = d, x = t², m = ½a. Then a = 2 × slope.
- d against t; the slope is the acceleration a: d against t curves upward because d depends on t², so it has no single slope.
- Correct: d against t²; the slope is ½a: Right: d = (½a)(t²) has the form y = mx with x = t², so the graph is a line through the origin with slope ½a.
- d against t²; the slope is twice the acceleration, 2a: The slope is the factor multiplying t², which is ½a, so a = 2 × slope, not slope = 2a.
- d² against t; the slope is half the acceleration: Squaring d does not undo the square on t; this graph is not a line either.
Part 9 · Summary
Summary
Part 10 · Up next
What comes next
Part 11 · Connections