Representing Motion
Motion can be shown as a motion diagram, x-t, v-t and a-t graphs, equations and words.
Part 1 · Hook
Why this matters
Part 2 · Before you start
What this builds on
Part 3 · Prerequisite check
Quick check before you start
1. What does the slope of a graph of y against x tell you?
- How fast y changes per unit of x
- The value of y at x = 0
- The total of y times x
- The largest value of y
Show the answer
Slope = Δy/Δx, a rate, with units (y unit)/(x unit).
- Correct: How fast y changes per unit of x:
- The value of y at x = 0:
- The total of y times x:
- The largest value of y:
2. A cart's velocity changes from 2.0 m/s to 5.0 m/s in 1.5 s. What is its average acceleration?
- 2.0 m/s²
- 4.5 m/s²
- 3.0 m/s²
- 0.50 m/s²
Show the answer
a = Δv/Δt = 3.0 m/s ÷ 1.5 s = 2.0 m/s².
- Correct: 2.0 m/s²:
- 4.5 m/s²:
- 3.0 m/s²:
- 0.50 m/s²:
3. If Δx ∝ t², how does Δx change when t doubles?
- It becomes 4 times as large
- It doubles
- It halves
- It does not change
Show the answer
The factor squared: 2² = 4.
- Correct: It becomes 4 times as large:
- It doubles:
- It halves:
- It does not change:
Part 4 · See it
See it first
Part 5 · Step by step
How it works, step by step
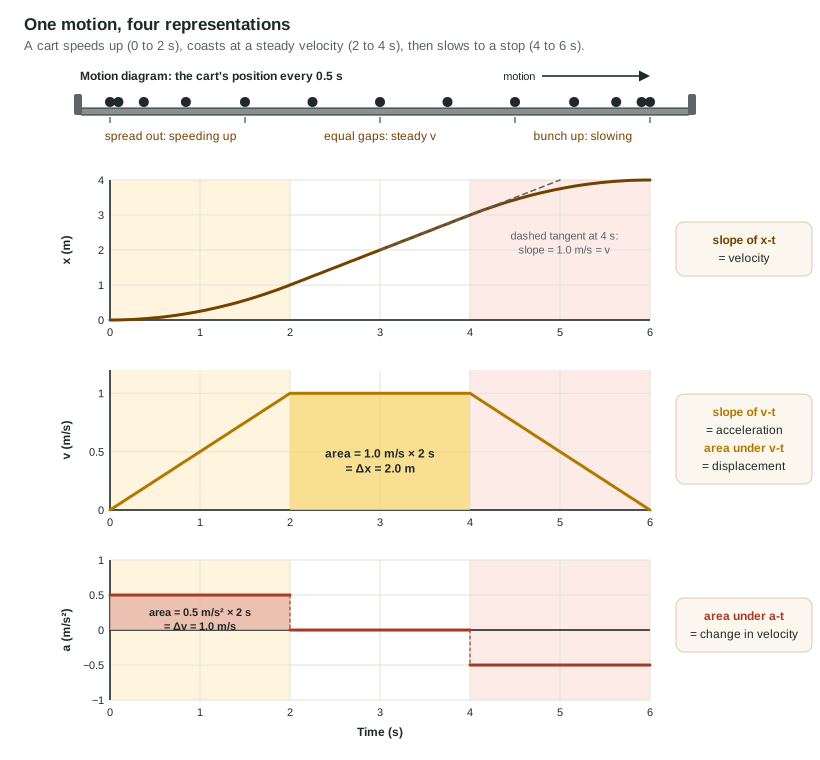
- Position changes with timethe slope of the x-t graph at any instant is the velocity
- Velocity changes with timethe slope of the v-t graph is the acceleration, and the area under it is the displacement
- The acceleration is constantthe v-t graph is a straight line and the three kinematic equations apply
- An object falls with air resistance negligibleits acceleration is g = 9.8 m/s² downward at every instant, even when v = 0 at the top
Part 6 · Key ideas
Key ideas
- A motion diagram shows positions at equal times: growing gaps mean speeding up, shrinking gaps mean slowing down.
- Slope of x-t = velocity. Slope of v-t = acceleration. Area under v-t = displacement. Area under a-t = change in velocity.
- For constant acceleration: v = v₀ + at; x = x₀ + v₀t + ½at²; v² = v₀² + 2a(x − x₀). Pick the one that leaves out the quantity you neither know nor want.
- Free fall: a = g = 9.8 m/s² downward (10 m/s² is accepted), on the way up, at the top and on the way down.
- If the acceleration changes (nonuniform), the v-t graph curves. Describe it from the graph only; the equations do not apply.
Part 7 · Misconception
A common mistake
The wrong idea: At the top of its flight a ball thrown straight up has zero acceleration, because it stops for an instant.
What actually happens: Its velocity is zero for an instant, but the velocity is still changing, from upward to downward, at 9.8 m/s² each second. The acceleration is g downward at the top, as everywhere else in the flight.
Part 8 · Check yourself
Check yourself
Exam-style questions. Anything you miss goes into your review queue.
Graph
A car between two traffic lights
A car pulls away from a red light, cruises, then brakes for the next light. The graph shows its velocity, with the direction of travel positive. Each part of the motion has a constant acceleration.
Data table
| Time (s) | Car |
|---|---|
| 0 | 0 |
| 4 | 12 |
| 10 | 12 |
| 14 | 0 |
1. What is the car's acceleration from t = 0 to t = 4.0 s?
Type a number and its unit.
Show the answer
The acceleration is the slope of the v-t graph: (12 m/s − 0) ÷ (4.0 s − 0) = 3.0 m/s².
- Answer: 3.0 m/s^2
2. How far does the car travel from t = 0 to t = 14 s?
Type a number in m.
Show the answer
Displacement is the area under the v-t graph: triangle ½(4.0 s)(12 m/s) = 24 m, rectangle (6.0 s)(12 m/s) = 72 m, triangle ½(4.0 s)(12 m/s) = 24 m. Total = 120 m (two significant figures).
- Answer: 120 m
3. During which interval is the car's acceleration negative?
- From 0 to 4 s
- From 4 s to 10 s
- At no time, since the velocity stays positive
- From 10 s to 14 s
Show the answer
Acceleration is the slope of the v-t graph. The slope is negative from 10 s to 14 s, while the car is still moving forward but slowing.
- From 0 to 4 s: The graph rises there, so the slope is positive: the car speeds up.
- From 4 s to 10 s: The graph is flat there, so the slope is zero: steady velocity, no acceleration.
- At no time, since the velocity stays positive: Velocity and acceleration have separate signs. The velocity is positive while it decreases, so a is negative.
- Correct: From 10 s to 14 s: Right: the v-t graph slopes downward there, so the slope (the acceleration) is negative.
Diagram
A ball tossed up from a balcony
A student on a balcony 15 m above the ground throws a ball straight up at 12 m/s. The ball rises, stops for an instant, then falls past the balcony to the ground. Air resistance is negligible. Take up as positive and g = 9.8 m/s².
Key: gold arrow, the initial velocity; dashed line, the path of the ball.
4. How long does the ball take to reach its highest point? Use g = 9.8 m/s².
Type a number in s.
Show the answer
At the top v = 0. Use v = v₀ + at with a = −9.8 m/s²: 0 = 12 m/s − (9.8 m/s²)t, so t = 12 ÷ 9.8 = 1.2 s.
- Answer: 1.2 s
5. What is the ball's acceleration at its highest point?
- Zero, because the ball is momentarily at rest
- 9.8 m/s² downward
- 9.8 m/s² upward, because the ball was thrown up
- Smaller than 9.8 m/s², because the ball has slowed down
Show the answer
Free fall means a = g downward at every point of the flight: on the way up, at the top and on the way down.
- Zero, because the ball is momentarily at rest: v = 0 is not a = 0: the velocity is changing from upward to downward at that instant.
- Correct: 9.8 m/s² downward: Right: in free fall the acceleration is g downward the whole time, including the instant the velocity is zero.
- 9.8 m/s² upward, because the ball was thrown up: The throw sets the initial velocity, not the acceleration; once released, the acceleration points down.
- Smaller than 9.8 m/s², because the ball has slowed down: The acceleration does not depend on the speed; it stays 9.8 m/s² down throughout the flight.
6. A cart starts with a known velocity and speeds up with a known constant acceleration over a measured distance. The time is not known and not asked for. Which equation gives its final velocity most directly?
- v = v₀ + at
- v² = v₀² + 2a(x − x₀)
- x = x₀ + v₀t + ½at²
- v(avg) = Δx/Δt
Show the answer
Choose the equation that contains the unknown and the knowns and leaves out the quantity you do not have. Each constant-acceleration equation leaves out one quantity; v² = v₀² + 2aΔx leaves out t.
- v = v₀ + at: This needs the time, which is not known.
- Correct: v² = v₀² + 2a(x − x₀): Right: it links v, v₀, a and the displacement without t.
- x = x₀ + v₀t + ½at²: This needs t, and it does not contain the final velocity.
- v(avg) = Δx/Δt: This needs the time, and an average velocity is not the final velocity.
7. A motion diagram shows a cart's positions at equal time intervals. The dots get closer together from left to right while the cart moves right. What are the directions of its velocity and acceleration?
- Velocity to the right, acceleration to the right
- Velocity to the right, acceleration to the left
- Velocity to the left, acceleration to the left
- Velocity to the right, zero acceleration
Show the answer
Spacing shows speed: bigger gaps mean faster. Shrinking gaps while moving right mean v right and a left.
- Velocity to the right, acceleration to the right: That would make the gaps grow: speeding up.
- Correct: Velocity to the right, acceleration to the left: Right: it moves right, and shrinking gaps mean it is slowing, so a points opposite to v.
- Velocity to the left, acceleration to the left: The cart moves right, so its velocity points right.
- Velocity to the right, zero acceleration: Zero acceleration would give equal gaps.
Part 9 · Summary
Summary
Part 10 · Up next
What comes next
Part 11 · Connections