
Two invented countries have the same average income. In one, a nurse, a farmer and a bank manager live within a short walk of each other's standard of living. In the other, half of all income goes to the top fifth of households. The average hides the difference completely. Economists use one curve, and one number drawn from it, to show how income is shared.
The Lorenz curve
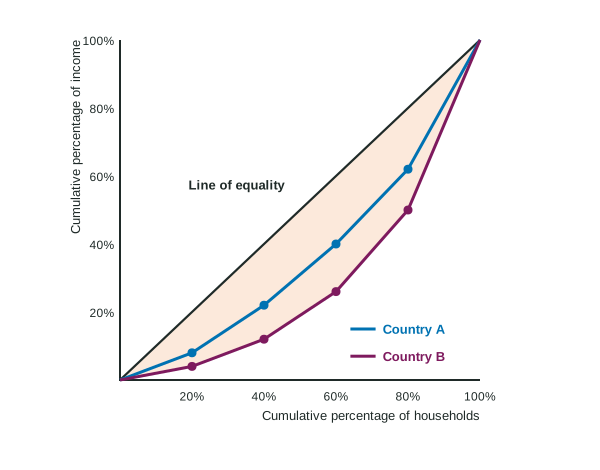
Rank every household from lowest income to highest and split them into equal groups, usually fifths. Then add up the shares as you go: the lowest fifth's share, then the lowest two fifths' combined share, and so on, until all households hold 100 percent of income. Plot each running total. The result is the Lorenz curve.
- Horizontal axis: cumulative percentage of households, from the poorest.
- Vertical axis: cumulative percentage of income they hold.
- Line of equality: the diagonal. If every household had the same income, the lowest 20 percent would hold 20 percent of income, the lowest 40 percent would hold 40 percent, and so on.
Real Lorenz curves bow below the diagonal, and both ends always meet it at 0 and 100 percent. The further the curve bows below the line of equality, the more unequal the distribution.
Worked example: building the curve. In the invented country of Velmora, the five fifths of households, from lowest to highest, receive 3, 8, 15, 24 and 50 percent of income.
- Running totals: 3; ; ; ; .
- Points: (20, 3), (40, 11), (60, 26), (80, 50), (100, 100), plus (0, 0).
- Compare with equality: at 60 percent of households the line of equality is at 60 percent of income, but Velmora's curve is at 26: a gap of 34 percentage points.
The usual slip is to plot each fifth's own share (15 at 60 percent) instead of the running total (26).
The Gini coefficient
The Gini coefficient turns the picture into one number: the area between the line of equality and the Lorenz curve, as a share of the whole triangle under the line. It runs from 0 (every household has the same income: the curve is the diagonal) to 1 (one household has all the income). A rise in a country's Gini coefficient means income became less equally shared. You should know what it measures and which way is more unequal; this course does not ask you to calculate it.
Income and wealth
Income is a flow: the wages, rent, interest and profit a household receives over a year (Topic 5.1). Wealth is a stock: the value of what a household owns, such as savings, a home, land or a business. Wealth is usually shared far less equally than income, and the two are linked, because wealth earns income and high income can be saved into wealth. A Lorenz curve can be drawn for either.
Where inequality comes from
- Skills and training (human capital): workers whose skills have a high MRP earn more (Unit 5).
- Inherited wealth, which earns income without work.
- Discrimination in hiring or pay, which lowers some groups' earnings.
- Market power, which lets some firms and their owners earn economic profit, and monopsony, which holds some wages down.
- Effort, choices and luck: hours worked, career choices, health and good or bad fortune.
Taxes and transfers
Taxes are classified by the share of income they take, the average tax rate (tax ÷ income):
| Tax | As income rises, the share of income taken | Effect on the after-tax Lorenz curve |
|---|---|---|
| Progressive | rises | moves it toward equality |
| Proportional | stays the same | leaves shares unchanged |
| Regressive | falls | moves it away from equality |
Worked example: classifying a tax. Under one invented plan, households earning $20,000, $50,000 and $100,000 pay $2,000, $3,000 and $4,000.
- Rates: , , .
- Classify: the share falls as income rises, so the tax is regressive, even though the highest earner pays the most dollars.
Paying more dollars does not make a tax progressive. A tax that takes 5 percent from everyone is proportional, though the richest pay the most dollars. Judge by the share of income.
Transfer payments are payments from the government, such as cash aid to low-income households, with no good or service given in return. Progressive taxes and transfers both raise the share of income held by lower-income households, so the Lorenz curve for income after taxes and transfers lies closer to the line of equality than the curve for income before them. How far a society should go in that direction is a question of values, which economics can inform but not settle.