Curves That Cross and Areas
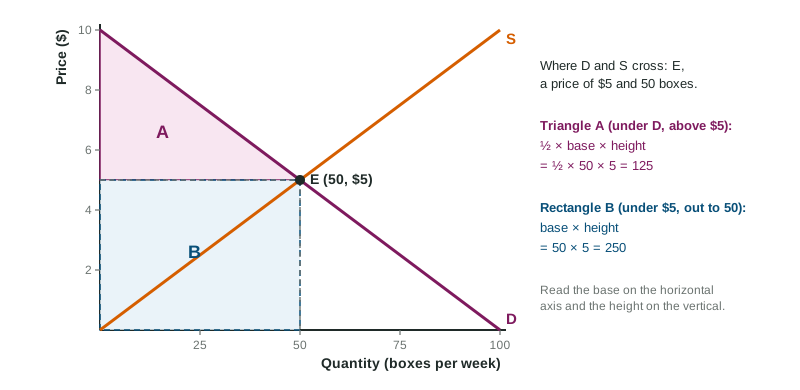
Where a downward curve and an upward curve cross, one price and one quantity lie on both curves: the intersection.
Part 1 · Hook
Why this matters
Part 2 · Before you start
What this builds on
Part 3 · Prerequisite check
Quick check before you start
1. A curve shifts right when
- something other than its own price changes and a larger quantity goes with every price
- the price of the good falls
- the price of the good rises
- the graph is relabeled
Show the answer
A shift comes from a change off the axes.
- Correct: something other than its own price changes and a larger quantity goes with every price:
- the price of the good falls:
- the price of the good rises:
- the graph is relabeled:
2. The slope of a line through (0, 10) and (50, 5) is
- -0.1
- -10
- 0.1
- 5
Show the answer
Rise -5 over run 50.
- Correct: -0.1:
- -10:
- 0.1:
- 5:
Part 4 · See it
See it first
Part 5 · Step by step
How it works, step by step
- A downward curve and an upward curve sit on the same graphthey cross at exactly one point
- You read the crossing pointyou get one price and one quantity that lie on both curves
- One curve shiftsthe crossing point slides along the curve that did not move to a new price and quantity
- You compare the old and new crossing pointsyou state which way the price and the quantity each changed
Part 6 · Key ideas
Key ideas
- The intersection (crossing point) of two curves is the one point on both. Read its price and quantity with dashed lines to both axes.
- When one curve shifts, the crossing point slides along the curve that stayed put. Label the old point E1 and the new one E2.
- Area of a rectangle = base × height. Area of a triangle = ½ × base × height.
- Read a base along the horizontal axis and a height along the vertical axis, from the shape's own edges.
Part 7 · Misconception
A common mistake
The wrong idea: The area of the triangle under D and above $5, out to 50 boxes, is 50 × 5 = 250.
What actually happens: That is the rectangle around the triangle. The triangle is half of it: ½ × 50 × 5 = 125.
Part 8 · Check yourself
Check yourself
Exam-style questions. Anything you miss goes into your review queue.
1. What is true at the point where two curves on a graph cross?
- The two curves have the same slope there
- The price is at its highest value on the graph
- The point lies on both curves, so both share its price and quantity
- The quantity is 0
Show the answer
An intersection is the one point that sits on both curves at once, so both curves give the same price and quantity there.
- The two curves have the same slope there: A downward curve and an upward curve have opposite slopes, even where they cross.
- The price is at its highest value on the graph: The crossing point can be at any height.
- Correct: The point lies on both curves, so both share its price and quantity: Right: one point, on both curves.
- The quantity is 0: The crossing point usually sits well away from the vertical axis.
Graph
A market graph with a shaded triangle and rectangle
2. In the graph, at what price and quantity do D and S cross?
- $5 and 50 boxes
- $10 and 0 boxes
- $5 and 100 boxes
- $50 and 5 boxes
Show the answer
Follow the dashed lines from E: across to $5 on the price axis and down to 50 boxes on the quantity axis.
- Correct: $5 and 50 boxes: Right: E is at (50, $5).
- $10 and 0 boxes: That is where D meets the price axis, not where D meets S.
- $5 and 100 boxes: 100 boxes is where D reaches the quantity axis.
- $50 and 5 boxes: This swaps the values: the quantity is 50 and the price is $5.
3. What is the area of triangle A, which lies under D and above the $5 price, from 0 to 50 boxes?
Type a number. A four-function calculator is allowed, as on the exam.
Show the answer
Base: 50 boxes (from 0 to 50). Height: $10 - $5 = $5. Area . Unit 2 names this triangle consumer surplus.
- Answer: 125
4. More shoppers start coming to the market, so at every price buyers want more boxes of strawberries. Shift the right curve and mark the new crossing point.
Work on the graph (it needs JavaScript), then check.
Show the answer
More buyers shift D right. The new crossing point slides up along S: a higher price and a larger quantity.
- Key: demand shifts right
5. Shade the triangle that lies under the downward-sloping curve D and above the horizontal line through the crossing point, from 0 out to the crossing quantity.
Work on the graph (it needs JavaScript), then check.
Show the answer
The triangle has the vertical axis on its left, D on top and the horizontal line at the crossing price below, and it ends at the crossing quantity. Unit 2 names this triangle consumer surplus.
- Key: shade consumer surplus
Part 9 · Summary
Summary
Part 10 · Up next
What comes next
Part 11 · Connections