The Loanable Funds Market
The loanable funds market brings together saving (supply) and borrowing (demand), and its price is the real interest rate.
Part 1 · Hook
Why this matters
Part 2 · Before you start
What this builds on
Part 3 · Prerequisite check
Quick check before you start
1. A loan has a nominal interest rate of 6% and the expected inflation rate is 2%. What is the real interest rate?
- 4%
- 8%
- 3%
- 12%
Show the answer
Real = nominal - expected inflation rate = 6% - 2% = 4%.
- Correct: 4%:
- 8%:
- 3%:
- 12%:
2. In a market graph, demand shifts right while supply stays put. What happens to the price and quantity?
- Both rise
- Both fall
- Price rises and quantity falls
- Price falls and quantity rises
Show the answer
A rightward shift of demand along upward-sloping supply raises both.
- Correct: Both rise:
- Both fall:
- Price rises and quantity falls:
- Price falls and quantity rises:
Part 4 · See it
See it first
Part 5 · Step by step
How it works, step by step
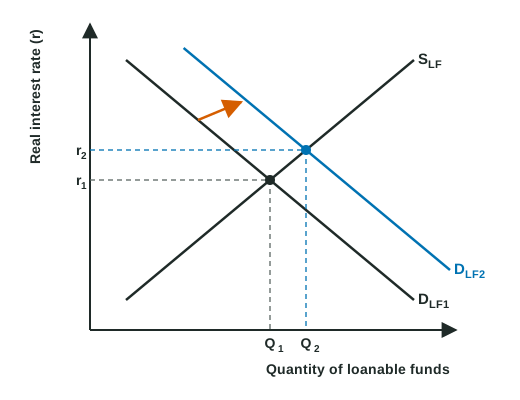
- The government spends more than it collects and borrows the differencethe demand for loanable funds shifts right
- The demand for loanable funds shifts rightthe real interest rate rises
- The real interest rate risesborrowing costs more for firms, so the quantity of private investment falls
Part 6 · Key ideas
Key ideas
- The loanable funds market: real interest rate on the vertical axis, quantity of loanable funds on the horizontal; supply (SLF) slopes up and demand (DLF) slopes down.
- Supply comes from saving: national saving = private saving + public saving, where public saving = tax revenue - government spending.
- Demand comes from borrowers: firms that invest, households and a government that spends more than it collects.
- More government borrowing shifts DLF right, so the real interest rate rises and private investment falls. More private saving shifts SLF right and lowers the real rate.
Part 7 · Misconception
A common mistake
The wrong idea: The loanable funds graph uses the nominal interest rate, just like the money market.
What actually happens: Savers and borrowers decide on the return after inflation, so the loanable funds graph uses the real interest rate. The money market uses the nominal rate.
Part 8 · Check yourself
Check yourself
Exam-style questions. Anything you miss goes into your review queue.
1. At a real interest rate below the equilibrium rate, firms want to borrow more. Label the axes and curves of the loanable funds graph, then mark point C on the demand curve at a real interest rate below equilibrium.
Work on the graph (it needs JavaScript), then check.
Show the answer
Loanable funds: the real interest rate (vertical) and the quantity of loanable funds (horizontal), DLF sloping down and SLF up. Along DLF a lower real rate means more borrowing, so C sits down and to the right of the equilibrium.
- Key: see the explanation
2. Firms become more optimistic about the profits from new equipment. Shift the right curve and mark the new equilibrium.
Work on the graph (it needs JavaScript), then check.
Show the answer
More planned investment means more borrowing at each real rate: the demand for loanable funds shifts right, raising the real interest rate and the quantity of loanable funds.
- Key: the demand for loanable funds shifts right
3. What goes on the vertical axis of the loanable funds graph?
- The nominal interest rate
- The quantity of loanable funds
- The price level
- The real interest rate
Show the answer
Loanable funds: real interest rate (r) on the vertical axis. Writing "nominal" loses the graph point.
- The nominal interest rate: The nominal rate goes on the money market graph. Saving and borrowing decisions depend on the real rate.
- The quantity of loanable funds: That goes on the horizontal axis.
- The price level: The price level goes on the AD-AS graph.
- Correct: The real interest rate: Right: savers and borrowers care about the return and cost after inflation.
Graph
A loanable funds market after a shift
4. The graph shows the demand for loanable funds shifting right. Which event could have caused it?
- Households decide to save more of their income
- The real interest rate falls
- The government borrows more to pay for new spending
- Firms expect lower profits from new equipment
Show the answer
The demand for loanable funds comes from borrowers: firms that invest, households and the government.
- Households decide to save more of their income: More saving shifts the supply of loanable funds right, not demand.
- The real interest rate falls: A change in the real interest rate moves along the curves; it does not shift them.
- Correct: The government borrows more to pay for new spending: Right: government borrowing adds to the demand for loanable funds.
- Firms expect lower profits from new equipment: Gloomier firms borrow less, which shifts demand left.
5. In the graph, what happens to the equilibrium real interest rate?
- It rises
- It falls
- It stays the same
- It falls, then returns
Show the answer
A rise in the demand for loanable funds raises the real interest rate and the quantity of loanable funds.
- Correct: It rises: Right: more demand for a given supply of loanable funds raises their price, the real interest rate.
- It falls: A rightward shift of demand along upward-sloping supply raises the rate.
- It stays the same: The demand shift moves the equilibrium up along the supply curve.
- It falls, then returns: The new equilibrium stays at the higher rate while the shift lasts.
6. Suppose the shift in the graph came from more government borrowing. What happens to the amount private firms borrow for investment?
- It rises, because more funds are lent in total
- It does not change, because firms' demand did not shift
- It falls, because the real interest rate is higher
- It rises, because the government is spending more
Show the answer
Government borrowing raises the real interest rate, and the higher rate lowers the quantity of private investment.
- It rises, because more funds are lent in total: More is lent in total, but the government takes a bigger share at a higher real rate.
- It does not change, because firms' demand did not shift: Firms' demand did not shift, but the higher real rate moves them along it to less borrowing.
- Correct: It falls, because the real interest rate is higher: Right: at the higher real rate, some private investment projects no longer pay off.
- It rises, because the government is spending more: Government spending does not lower firms' borrowing costs; the higher real rate raises them.
7. Make it specific: show more government borrowing as a change on the demand side of the loanable funds market, and explain how it affects private investment.
Build the answer part by part, then write it in your own words.
Show the answer
Government borrowing raises the demand for loanable funds, the real interest rate rises, and private investment falls because borrowing costs more.
- An answer that earns the point: The government borrows more, so the demand for loanable funds shifts right; the real interest rate increases, so private investment decreases because borrowing becomes more costly for firms.
Part 9 · Summary
Summary
Part 10 · Up next
What comes next
Part 11 · Connections