The Demographic Transition Model
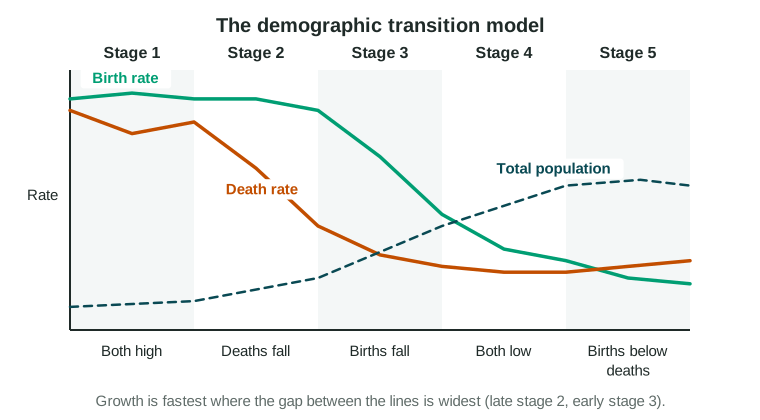
The demographic transition model describes death rates falling first and birth rates later, in five stages, so population growth speeds up and then slows or turns negative.
Part 1 · Hook
Why this matters
Part 2 · Before you start
What this builds on
Part 3 · Prerequisite check
Quick check before you start
1. A country has a CBR of 30 and a CDR of 10. What is its rate of natural increase?
- 2 percent
- 20 percent
- 3 percent
- 0.2 percent
Show the answer
(30 − 10) ÷ 10 = 2 percent.
- Correct: 2 percent:
- 20 percent:
- 3 percent:
- 0.2 percent:
2. Which measure counts deaths of babies under age 1 per 1,000 live births?
- Infant mortality rate
- Crude death rate
- Total fertility rate
- Life expectancy
Show the answer
The infant mortality rate measures deaths in the first year of life.
- Correct: Infant mortality rate:
- Crude death rate:
- Total fertility rate:
- Life expectancy:
Part 4 · See it
See it first
Part 5 · Step by step
How it works, step by step
- Food, clean water and vaccines improvethe death rate falls while births stay high (stage 2)
- Births stay high while deaths fallthe population grows very fast
- More children survive and children cost more in citiesfamilies have fewer children and the birth rate falls (stage 3)
- Both rates end up lowgrowth slows or stops (stage 4), and births may fall below deaths (stage 5)
Part 6 · Key ideas
Key ideas
- The demographic transition model (DTM) traces birth and death rates in five stages: 1 both high; 2 deaths fall; 3 births fall; 4 both low; 5 births below deaths.
- A country is never "in" a stage as a fact. Its data are consistent with a stage. Low growth can mean stage 1 (high rates) or stages 4 and 5 (low rates).
- The epidemiological transition traces the main causes of death: from infections and famine to chronic diseases such as heart disease and cancer, with new infections possible.
- Limits: built on European history; leaves out migration; timing differs; stage 5 is not universal; it describes, it does not predict.
Part 7 · Misconception
A common mistake
The wrong idea: A country whose population is hardly growing must be in stage 1 or 2.
What actually happens: Low growth can come from high rates (stage 1) or low rates (stages 4 and 5). Read the rates: low births and deaths, or deaths above births, are consistent with stage 4 or 5.
Part 8 · Check yourself
Check yourself
Exam-style questions. Anything you miss goes into your review queue.
Data
Birth and death rates in Country N, 1800 to 2020
Invented data for practice.
1. In which year on the chart is the gap between the birth rate and the death rate largest?
- About 1900
- About 1800
- About 1980
- About 2020
Show the answer
The gap is the rate of natural increase. It is widest when deaths have already fallen and births have not yet: around 1900 on this chart.
- Correct: About 1900: Right: in 1900 the birth rate is 36 and the death rate 19, a gap of 17 per 1,000.
- About 1800: in 1800 both rates are high and close (40 and 38), a gap of 2.
- About 1980: by 1980 both rates are low (13 and 10), a gap of 3.
- About 2020: in 2020 the death rate is above the birth rate, so the gap is negative.
2. The data for Country N around 1850 are consistent with which stage of the demographic transition model?
- Stage 1: both rates are high and close together
- Stage 2: the death rate falls while the birth rate stays high
- Stage 3: the birth rate falls and the gap narrows
- Stage 4: both rates are low and close together
Show the answer
Stage 2 starts when the death rate falls and the birth rate stays high, so the population grows fast. Country N’s data in about 1850 fit that pattern.
- Stage 1: both rates are high and close together: that fits 1800, before the death rate fell.
- Correct: Stage 2: the death rate falls while the birth rate stays high: Right: in 1840 to 1880 the death rate drops from 33 to 24 while births stay near 40.
- Stage 3: the birth rate falls and the gap narrows: the birth rate does not fall much until after 1880.
- Stage 4: both rates are low and close together: that fits about 1980 to 2000.
3. In 2020, Country N’s death rate is above its birth rate. Which stage are these data consistent with?
- Stage 1: high birth and death rates
- Stage 2: rapid growth
- Stage 5: natural decrease
- Stage 3: falling birth rate with fast growth
Show the answer
Stage 5 has very low birth rates that fall below death rates, so the population shrinks without migration. Low-growth data belong in stage 4 or 5, never in stage 1 or 2.
- Stage 1: high birth and death rates: both rates are low in 2020, not high.
- Stage 2: rapid growth: the population is not growing from natural increase at all.
- Correct: Stage 5: natural decrease: Right: more deaths than births means a negative rate of natural increase.
- Stage 3: falling birth rate with fast growth: stage 3 still has births well above deaths.
4. Order the stages of the epidemiological transition, from first to last.
The epidemiological transition
- Stage 1
- Stage 2
- Stage 3
- Stage 4
- Stage 5
Pick a piece, then the place it belongs. Drag works too. Pick a filled place to take its piece back.
Show the answer
Infections and famine first; then pandemics recede; then chronic diseases (heart disease, cancer) lead; then they come later in life; some add a stage of reemerging infectious disease.
- Stage 1: Pestilence and famine
- Stage 2: Receding pandemics
- Stage 3: Degenerative and human-created
- Stage 4: Delayed degenerative diseases
- Stage 5: Reemerging infections
5. What does the demographic transition model describe?
- How people move from the countryside to cities in stages
- How birth and death rates change over time as a society changes
- How food supply grows more slowly than population over time
- How the main causes of death shift from infection to chronic disease
Show the answer
The demographic transition model describes a sequence: death rates fall first, then birth rates, so population growth speeds up and then slows. It is a model drawn from history, not a law.
- How people move from the countryside to cities in stages: the model is about births and deaths, not moves.
- Correct: How birth and death rates change over time as a society changes: Right: it traces a sequence of stages of births and deaths.
- How food supply grows more slowly than population over time: that is a different theory, about food.
- How the main causes of death shift from infection to chronic disease: that is the epidemiological transition.
6. In many countries of Asia and Africa, death rates fell much faster after 1950 than they did in Europe in the 1800s. What limitation of the model does this show?
- Its stage timing comes from European history
- It says death rates rise in stage 2, which is not true in Asia
- It has too few stages to show falling death rates
- It includes migration, which changes death rates
Show the answer
The model was built from the history of Europe and North America. Later, medicine and public health arrived from abroad, so deaths fell faster and populations grew faster than the model’s timing suggests.
- Correct: Its stage timing comes from European history: Right: imported vaccines and medicine cut deaths in decades, not a century.
- It says death rates rise in stage 2, which is not true in Asia: the model says death rates fall in stage 2.
- It has too few stages to show falling death rates: stage 2 shows falling death rates.
- It includes migration, which changes death rates: the model leaves out migration.
Part 9 · Summary
Summary
Part 10 · Up next
What comes next
Part 11 · Connections