Supply
Supply shows how much sellers offer at each price.
Part 1 · Hook
Why this matters
Part 2 · Before you start
What this builds on
Part 3 · Prerequisite check
Quick check before you start
1. Land, labor, capital and entrepreneurship are
- the factors of production
- the determinants of demand
- types of goods
- kinds of markets
Show the answer
They are the resources used to produce goods and services.
- Correct: the factors of production:
- the determinants of demand:
- types of goods:
- kinds of markets:
2. A price change that moves buyers from one point to another on the same demand curve is
- a movement along the curve
- a shift of the curve
- an increase in demand
- a decrease in demand
Show the answer
A change in the good's own price is a movement along the curve.
- Correct: a movement along the curve:
- a shift of the curve:
- an increase in demand:
- a decrease in demand:
3. A curve that slopes up from left to right shows
- a direct relationship
- an inverse relationship
- no relationship
- a fixed price
Show the answer
Both variables rise together.
- Correct: a direct relationship:
- an inverse relationship:
- no relationship:
- a fixed price:
Part 4 · See it
See it first
Part 5 · Step by step
How it works, step by step
- The price of a good rises, other things equaleach unit sells for more
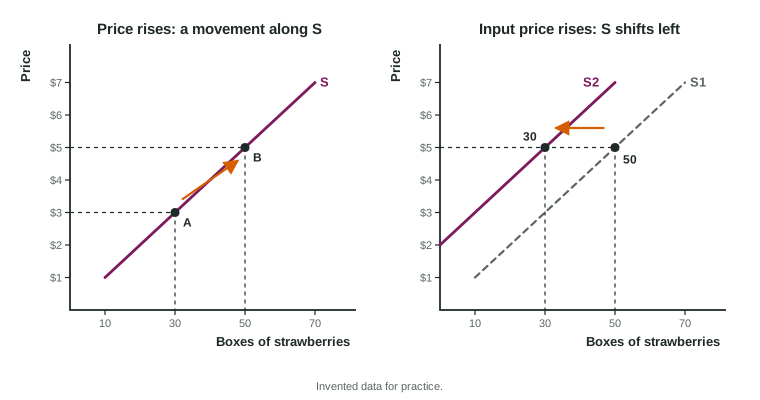
- A higher price covers the rising cost of producing extra unitssellers offer more: the quantity supplied rises
- The quantity supplied rises because of the good's own pricesellers move up along the same supply curve; the curve does not shift
Part 6 · Key ideas
Key ideas
- Law of supply: other things equal, a higher price means a larger quantity supplied. The curve slopes up.
- A change in the good's own price is a movement along the curve: a change in quantity supplied.
- A change in a determinant shifts the whole curve: input prices, technology, the prices of other goods the seller could make, taxes and subsidies, expectations, the number of sellers.
- A shift left is a decrease in supply (less at each price); a shift right is an increase.
- Market supply is the horizontal sum of every seller's quantity at each price.
Part 7 · Misconception
A common mistake
The wrong idea: An increase in supply moves the supply curve up.
What actually happens: An increase in supply moves the curve to the right: more is offered at each price. Because supply slopes up, a rightward shift also sits lower on the graph, so "up" for a curve that slopes up means less supply, not more. Say right and left.
Part 8 · Check yourself
Check yourself
Exam-style questions. Anything you miss goes into your review queue.
1. Label the axes and the curve of a market supply graph for bicycles.
Work on the graph (it needs JavaScript), then check.
Show the answer
Price goes on the vertical axis and quantity on the horizontal axis. The upward-sloping curve is supply, S: sellers offer more bicycles at higher prices.
- Key: see the explanation
2. The price of flour, the main input for bread, rises. Shift the right curve in the market for bread.
Work on the graph (it needs JavaScript), then check.
Show the answer
A higher input price raises the cost of making each loaf, so bakers offer fewer loaves at each price: supply shifts left.
- Key: supply shifts left
Data
Two farms selling strawberries at a weekend market
| Price per box | Fennel Farm | Ridge Farm |
|---|---|---|
| $2 | 12 | 8 |
| $3 | 16 | 14 |
| $4 | 20 | 20 |
| $5 | 24 | 26 |
3. If Fennel Farm and Ridge Farm are the only sellers, what is the market quantity supplied at $4 a box?
Type a number. A four-function calculator is allowed, as on the exam.
Show the answer
Market supply adds every seller's quantity at the same price: boxes.
- Answer: 40
4. The market price of strawberries rises from $3 to $5 a box. What happens in the market?
- Supply shifts right from 30 to 50 boxes
- Quantity supplied falls from 50 to 30 along the curve
- Quantity supplied rises from 30 to 50 along the supply curve
- Supply shifts left because buyers pay more
Show the answer
A change in the good's own price moves sellers along supply. The market quantity supplied rises from 30 to 50 boxes; supply itself does not shift.
- Supply shifts right from 30 to 50 boxes: A change in the own price does not shift supply.
- Quantity supplied falls from 50 to 30 along the curve: That is the change for a price fall from $5 to $3.
- Correct: Quantity supplied rises from 30 to 50 along the supply curve: Right: the own price changed, so sellers move along the curve.
- Supply shifts left because buyers pay more: What buyers pay does not move the sellers' curve.
Scenario
Four events for the furniture workshops of Larkfield
Larkfield is an invented town where small workshops make wooden chairs. Four things happen over one year:
- A storm closes forests in the region and the price of lumber jumps.
- Workshops start using a new laser cutter that halves the time it takes to shape each chair.
- The town starts paying each workshop $20 for every chair it produces.
- Workshop owners hear that chair prices will rise sharply next month.
5. Event 1: the price of lumber jumps. What happens to the supply of chairs?
- Supply shifts right
- Supply shifts left
- Quantity supplied rises along the curve
- Demand for chairs shifts left
Show the answer
Lumber is an input. A higher input price raises the cost of each chair, so workshops offer fewer chairs at each price: supply shifts left.
- Supply shifts right: Costlier inputs make each chair more expensive to produce.
- Correct: Supply shifts left: Right: a higher input price lowers supply.
- Quantity supplied rises along the curve: The chair price did not change; an input price did.
- Demand for chairs shifts left: Lumber is an input for sellers, so supply changes.
6. Event 2: workshops start using a laser cutter. What happens to the supply of chairs?
- Supply shifts left
- Supply shifts right
- Quantity supplied falls along the curve
- Demand for chairs shifts right
Show the answer
Better technology lowers the cost of producing each chair, so workshops offer more chairs at each price: supply shifts right.
- Supply shifts left: A faster way to make chairs makes producing them cheaper.
- Correct: Supply shifts right: Right: better technology raises supply.
- Quantity supplied falls along the curve: The price of chairs did not change.
- Demand for chairs shifts right: The cutter changes how chairs are made, not how many buyers want.
Part 9 · Summary
Summary
Part 10 · Up next
What comes next
Part 11 · Connections