Demand
Demand shows how much buyers want at each price.
Part 1 · Hook
Why this matters
Part 2 · Before you start
What this builds on
Part 3 · Prerequisite check
Quick check before you start
1. Each extra slice of pizza you eat at a party satisfies you a little less than the one before. This is
- diminishing marginal utility
- a sunk cost
- an opportunity cost of zero
- a rise in total utility for each slice
Show the answer
Marginal utility, the extra satisfaction from one more unit, falls as you have more.
- Correct: diminishing marginal utility:
- a sunk cost:
- an opportunity cost of zero:
- a rise in total utility for each slice:
2. On a graph, a change that moves the whole curve to a new position is
- a shift of the curve
- a movement along the curve
- a change in the slope only
- a new point on the same curve
Show the answer
A shift moves the whole curve; a movement along it changes the point on the same curve.
- Correct: a shift of the curve:
- a movement along the curve:
- a change in the slope only:
- a new point on the same curve:
3. A curve that slopes down from left to right shows
- an inverse relationship
- a direct relationship
- no relationship
- a fixed quantity
Show the answer
As one variable rises, the other falls.
- Correct: an inverse relationship:
- a direct relationship:
- no relationship:
- a fixed quantity:
Part 4 · See it
See it first
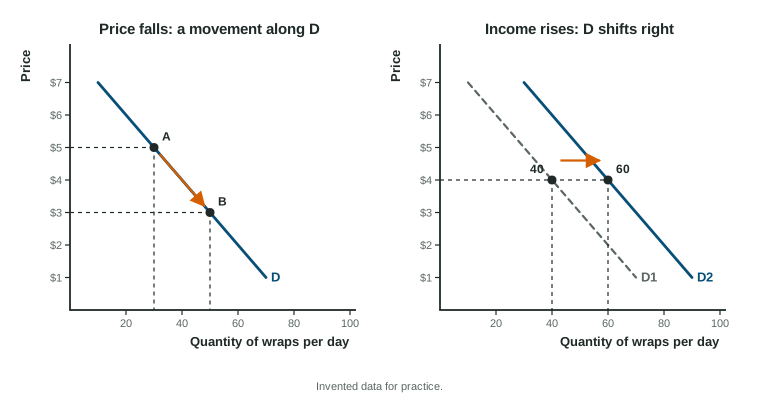
Part 5 · Step by step
How it works, step by step
- The price of a good falls, other things equalthe good is cheaper than its substitutes and buyers' money goes further
- Buyers switch toward it and can afford more (the substitution and income effects)the quantity demanded rises
- The quantity demanded rises because of the good's own pricebuyers move down along the same demand curve; the curve does not shift
Part 6 · Key ideas
Key ideas
- Law of demand: other things equal, a higher price means a smaller quantity demanded. The curve slopes down.
- It slopes down because of the substitution effect, the income effect and diminishing marginal utility.
- A change in the good's own price is a movement along the curve: a change in quantity demanded.
- A change in a determinant shifts the whole curve: tastes, income (normal or inferior), prices of substitutes and complements, expectations, the number of buyers.
- Market demand is the horizontal sum of every buyer's quantity at each price.
Part 7 · Misconception
A common mistake
The wrong idea: When a good gets cheaper, its demand increases, so the demand curve shifts right.
What actually happens: A lower own price raises the quantity demanded: a movement down along the same curve. Demand shifts only when something other than the good's own price changes, such as income or the price of a related good.
Part 8 · Check yourself
Check yourself
Exam-style questions. Anything you miss goes into your review queue.
1. Label the axes and the curve of a market demand graph for concert tickets.
Work on the graph (it needs JavaScript), then check.
Show the answer
Price goes on the vertical axis and quantity on the horizontal axis. The curve that slopes down is demand, D: as the price falls, buyers want more tickets.
- Key: see the explanation
2. The price of printer ink rises sharply. Ink and printers are used together. Shift the right curve in the market for printers.
Work on the graph (it needs JavaScript), then check.
Show the answer
Ink and printers are complements. A higher price of ink makes owning a printer more costly, so buyers want fewer printers at each price: demand for printers shifts left.
- Key: demand shifts left
Data
Three buyers of smoothies at a gym cafe
| Price | Ana | Ben | Cai |
|---|---|---|---|
| $2 | 6 | 4 | 5 |
| $3 | 5 | 3 | 4 |
| $4 | 4 | 2 | 2 |
| $5 | 3 | 1 | 0 |
3. The table shows how many smoothies each of the three buyers in the cafe would buy per week. If they are the only buyers, what is the market quantity demanded at a price of $4?
Type a number. A four-function calculator is allowed, as on the exam.
Show the answer
Market demand is the horizontal sum of individual demands: add the quantities at the same price. At $4: smoothies.
- Answer: 8
4. The cafe cuts the smoothie price from $4 to $3. What happens in the market for its smoothies?
- Demand shifts right because the smoothies are cheaper
- A movement along demand: quantity demanded falls from 12 to 8
- A movement along demand: quantity demanded rises from 8 to 12
- Demand shifts left because each smoothie earns the cafe less
Show the answer
A change in the good's own price is a movement along the demand curve. The market quantity demanded rises from 8 to 12; demand itself does not change.
- Demand shifts right because the smoothies are cheaper: A lower own price does not shift demand; it moves buyers along it.
- A movement along demand: quantity demanded falls from 12 to 8: That is the change for a price rise from $3 to $4.
- Correct: A movement along demand: quantity demanded rises from 8 to 12: Right: the own price changed, so buyers move along the curve.
- Demand shifts left because each smoothie earns the cafe less: The cafe's earnings do not move the buyers' curve.
Scenario
Four news items about e-scooter rentals in Porthaven
Porthaven is an invented city where riders rent e-scooters by the trip. A local paper ran four items in one month:
- The rental company raised its price per trip from $3 to $4.
- The city raised bus fares by 50 cents.
- A survey found that riders expect the rental price to jump next month.
- A factory closed, and many residents earn less. Riders who can afford a car or a bike tend to stop renting scooters.
5. Item 1 reports a higher price per trip. How does it affect the market for scooter rentals?
- Demand for rentals shifts left
- Quantity demanded falls along the demand curve
- Demand for rentals shifts right
- Quantity demanded rises along the demand curve
Show the answer
The rental price is the good's own price. A rise moves riders along the demand curve: quantity demanded falls. Demand does not shift.
- Demand for rentals shifts left: A change in the own price is a movement along demand, not a shift.
- Correct: Quantity demanded falls along the demand curve: Right: the own price changed.
- Demand for rentals shifts right: A higher price does not raise demand.
- Quantity demanded rises along the demand curve: By the law of demand, a higher price lowers quantity demanded.
6. Item 2 reports higher bus fares. How does it affect the demand for scooter rentals?
- Demand shifts left, because buses are a complement
- Demand shifts right, because buses are a substitute
- Quantity demanded rises along the demand curve
- No change, because bus fares are a different market
Show the answer
Buses and scooters are substitutes for getting around town. When the bus costs more, some riders switch to scooters, so demand for rentals shifts right.
- Demand shifts left, because buses are a complement: Riders use a bus or a scooter for a trip, so the two are substitutes.
- Correct: Demand shifts right, because buses are a substitute: Right: a higher price of a substitute raises demand.
- Quantity demanded rises along the demand curve: The rental price did not change; another good's price did, which shifts demand.
- No change, because bus fares are a different market: Prices of related goods are a determinant of demand.
Part 9 · Summary
Summary
Part 10 · Up next
What comes next
Part 11 · Connections