Opportunity Cost and the Production Possibilities Curve (PPC)
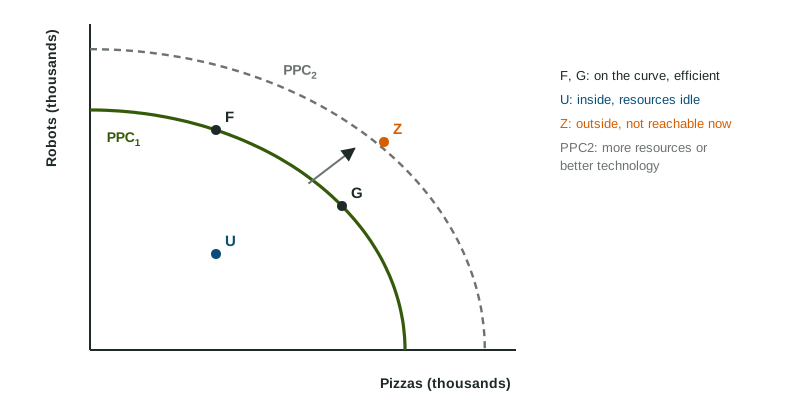
Opportunity cost is the next-best alternative you give up, and the production possibilities curve shows it for a whole economy: every point on the curve is efficient, points inside mean idle resources, and points outside are out of reach for now.
Part 1 · Hook
Why this matters
Part 2 · Before you start
What this builds on
Part 3 · Prerequisite check
Quick check before you start
1. Which statement describes scarcity?
- Wants are greater than the resources to meet them
- A store has run out of a product
- Prices are high
- A country is poor
Show the answer
Scarcity is the gap between unlimited wants and limited resources.
- Correct: Wants are greater than the resources to meet them:
- A store has run out of a product:
- Prices are high:
- A country is poor:
2. A curve that bows outward from the origin has a slope that
- gets steeper as it falls toward the horizontal axis
- stays the same everywhere
- is positive
- is zero
Show the answer
A bowed-out curve starts flat and gets steeper as it falls.
- Correct: gets steeper as it falls toward the horizontal axis:
- stays the same everywhere:
- is positive:
- is zero:
3. Machines and tools used to make other goods are which factor of production?
- Capital
- Land
- Labor
- Entrepreneurship
Show the answer
Capital is made goods used in production.
- Correct: Capital:
- Land:
- Labor:
- Entrepreneurship:
Part 4 · See it
See it first
Part 5 · Step by step
How it works, step by step
- An economy uses all its resources efficientlyit produces at a point on its PPC
- It moves along the PPC to make more of one goodit gives up some of the other good: the opportunity cost
- Resources are not equally suited to both goodseach extra unit costs more of the other good, so the PPC bows outward
- Resources grow or technology improvesthe whole PPC shifts outward, and points once out of reach become possible
Part 6 · Key ideas
Key ideas
- Opportunity cost: the value of the next-best alternative given up. Per unit, it is what you give up divided by what you gain.
- On the PPC: efficient. Inside: idle or misused resources (a recession). Outside: unattainable with today's resources and technology.
- Bowed out means increasing opportunity cost (specialized resources); a straight line means constant opportunity cost.
- More resources or better technology shift the PPC outward, which is economic growth; a disaster shifts it inward. Moving resources between the two goods is a movement along it.
Part 7 · Misconception
A common mistake
The wrong idea: Putting idle factories back to work shifts the PPC outward.
What actually happens: Idle resources put the economy inside its PPC; using them moves the economy toward the curve. Only more resources or better technology shift the curve itself outward.
Part 8 · Check yourself
Check yourself
Exam-style questions. Anything you miss goes into your review queue.
1. A recession leaves many factories idle and many workers without jobs. Place point U to show what the economy produces.
Work on the graph (it needs JavaScript), then check.
Show the answer
Idle resources mean the economy produces less of both goods than it could: a point inside the PPC.
- Key: see the explanation
2. A new technology raises how much of both goods the economy can make. Show the change on the graph.
Work on the graph (it needs JavaScript), then check.
Show the answer
Better technology lets the economy make more of both goods: the whole PPC shifts outward.
- Key: the production possibilities curve shifts out
Data
Dornia's production possibilities
| Combination | Wheat (millions of bushels) | Tractors (thousands) |
|---|---|---|
| 1 | 0 | 20 |
| 2 | 10 | 18 |
| 3 | 20 | 14 |
| 4 | 30 | 8 |
| 5 | 40 | 0 |
3. Using the table, what is the opportunity cost per million bushels of wheat when Dornia moves from combination 2 to combination 3?
Type a number. A four-function calculator is allowed, as on the exam.
Show the answer
Dornia gains 10 million bushels of wheat and gives up thousand tractors, so each million bushels costs thousand tractors.
- Answer: 0.4
4. Using the table, how many thousand tractors does Dornia give up in total to move from combination 3 to combination 4?
Type a number. A four-function calculator is allowed, as on the exam.
Show the answer
Tractors fall from 14 thousand to 8 thousand: thousand tractors given up for 10 million more bushels of wheat.
- Answer: 6
5. What does the table show about Dornia's opportunity cost of wheat as it makes more wheat?
- It stays the same: each extra 10 million bushels costs 2 thousand tractors
- It rises: each extra 10 million bushels costs more tractors than the last
- It falls: wheat gets cheaper to make as Dornia makes more
- It is impossible to find from a table
Show the answer
The tractors given up for each extra 10 million bushels are 2, 4, 6 and 8 thousand: increasing opportunity cost, so the PPC is bowed out.
- It stays the same: each extra 10 million bushels costs 2 thousand tractors: Only the first step costs 2 thousand; later steps cost more.
- Correct: It rises: each extra 10 million bushels costs more tractors than the last: Right: 2, then 4, then 6, then 8 thousand tractors.
- It falls: wheat gets cheaper to make as Dornia makes more: The cost of wheat rises, not falls, as Dornia moves along.
- It is impossible to find from a table: The differences between rows give the costs directly.
6. Jordan's Saturday options, in order of preference, are a hike with friends, a paid work shift worth $80, and studying. If Jordan goes on the hike, what is the opportunity cost?
- The work shift and the studying, added together
- Nothing, because the hike is free
- The studying, because it ranks last
- The $80 work shift, the next-best choice
Show the answer
Opportunity cost is the value of the next-best alternative given up, here the work shift. Jordan could not have done both other options with the same time.
- The work shift and the studying, added together: Jordan could have done only one of the other two, so only the best of them counts.
- Nothing, because the hike is free: Even a free activity costs the time that could have earned $80.
- The studying, because it ranks last: The lowest-ranked option is not what Jordan would have done instead.
- Correct: The $80 work shift, the next-best choice: Right: only the next-best option counts.
7. A country's PPC is a straight line from 60 thousand shirts (and no jackets) to 20 thousand jackets (and no shirts). What is the opportunity cost of one jacket, in shirts?
Type a number. A four-function calculator is allowed, as on the exam.
Show the answer
Making all 20 thousand jackets means giving up all 60 thousand shirts, so one jacket costs shirts. A straight line means the cost is the same everywhere on it.
- Answer: 3
Part 9 · Summary
Summary
Part 10 · Up next
What comes next
Part 11 · Connections