Where Curves Cross
Where two curves cross, they agree on one price and one quantity.
Part 1 · Hook
Why this matters
Part 2 · Before you start
What this builds on
Part 3 · Prerequisite check
Quick check before you start
1. Buyers' incomes rise and they want more of a good at every price. On the graph, D
- shifts right
- shifts left
- stays put while you move along it
- becomes vertical
Show the answer
A change off the axes shifts the curve; more wanted at every price is a shift right.
- Correct: shifts right:
- shifts left:
- stays put while you move along it:
- becomes vertical:
2. An upward-sloping curve shows that as price rises, quantity
- rises
- falls
- stays the same
- first rises then falls
Show the answer
Upward sloping means both rise together.
- Correct: rises:
- falls:
- stays the same:
- first rises then falls:
Part 4 · See it
See it first
Part 5 · Step by step
How it works, step by step
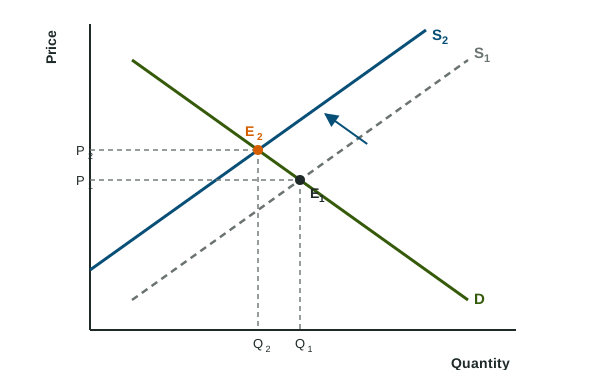
- Two curves cross at one pointthat point gives the one price and quantity both curves agree on (E1)
- One curve shiftsthe crossing moves along the other curve to a new point (E2)
- You draw dashed lines from E1 and E2 to both axesyou can compare the old and new price and quantity
- You state each change with its direction"the price rises from P1 to P2" earns the point
Part 6 · Key ideas
Key ideas
- The intersection point is where two curves cross: on a market graph, the price at which the quantity buyers want equals the quantity sellers offer.
- When one curve shifts, the crossing slides along the curve that did not move.
- A before-and-after comparison marks both crossings, E1 and E2, with dashed lines to both axes (P1, P2, Q1, Q2) and says which way each moved.
Part 7 · Misconception
A common mistake
The wrong idea: When a curve shifts right, the new crossing is always higher.
What actually happens: It depends on which curve moved. D shifting right slides up the upward curve S (higher price); S shifting right slides down the downward curve D (lower price). Follow the curve that did not move.
Part 8 · Check yourself
Check yourself
Exam-style questions. Anything you miss goes into your review queue.
1. Buyers want more umbrellas at every price after a rainy forecast. Shift the right curve and mark the new point where the curves cross.
Work on the graph (it needs JavaScript), then check.
Show the answer
D shifts right along the upward curve S, so the new crossing E2 is higher and to the right: a higher price and a larger quantity.
- Key: demand shifts right
2. A new machine lets bakers make bread more cheaply, so at every price they offer more loaves. Shift the right curve and mark the new crossing.
Work on the graph (it needs JavaScript), then check.
Show the answer
S shifts right down along D, so E2 is lower and to the right: a lower price and a larger quantity.
- Key: supply shifts right
3. On a market graph, what does the point where the two curves cross show?
- The highest price buyers will pay for the good
- The price at which the quantity buyers want equals the quantity offered
- The lowest price sellers will accept for the good
- The price at which buyers and sellers trade nothing
Show the answer
At the crossing both curves give the same quantity at the same price, so buyers and sellers agree.
- The highest price buyers will pay for the good: Buyers would pay more for the first few units; the crossing is where the curves meet.
- Correct: The price at which the quantity buyers want equals the quantity offered: Right: the two quantities match there.
- The lowest price sellers will accept for the good: Sellers would accept less for the first few units; the crossing is where the curves meet.
- The price at which buyers and sellers trade nothing: The crossing is where trade happens, not where it stops.
Data
Buyers and sellers of phone cases
| Price ($) | Cases buyers want | Cases sellers offer |
|---|---|---|
| 10 | 80 | 20 |
| 15 | 60 | 40 |
| 20 | 50 | 50 |
| 25 | 40 | 60 |
4. At which price in the table do the two curves cross?
- $15
- $20
- $25
- $10
Show the answer
At $20 buyers want 50 cases and sellers offer 50, the only row where the two quantities match.
- $15: At $15 buyers want 60 but sellers offer only 40.
- Correct: $20: Right: 50 wanted and 50 offered.
- $25: At $25 sellers offer 60 but buyers want only 40.
- $10: At $10 buyers want 80 but sellers offer only 20.
5. Using the table, at a price of $10, how many more cases do buyers want than sellers offer each week?
Type a number. A four-function calculator is allowed, as on the exam.
Show the answer
At $10 buyers want 80 and sellers offer 20: more cases wanted than offered.
- Answer: 60
6. Sellers find a cheaper supplier, and at each price they now offer 20 more cases than in the table. At what price do the curves cross now?
- $15
- $20
- $25
- $10
Show the answer
With 20 more offered, sellers offer 60 at $15, which matches the 60 buyers want there.
- Correct: $15: Right: 60 wanted and 60 offered at $15.
- $20: At $20 sellers would now offer 70 but buyers want 50.
- $25: At $25 sellers would now offer 80 but buyers want 40.
- $10: At $10 sellers would now offer 40 but buyers want 80.
Part 9 · Summary
Summary
Part 10 · Up next
What comes next
Part 11 · Connections