
Two lines can both "go up" and still say very different things. One climbs steeply; one barely tilts. The number that measures the tilt is the slope, and the shape of a curve is a short sentence about how its two variables move together.
Slope is rise over run
Pick any two points on a straight line. The rise is the change in the vertical value between them; the run is the change in the horizontal value. The slope is the rise divided by the run:
Subtract in the same order on top and bottom (second point minus first point, both times), and the sign takes care of itself: a line that rises to the right has a positive slope, a line that falls to the right has a negative one.
Worked example: find a slope from two points. A line passes through (2, 8) and (6, 4).
- Rise. The vertical value goes from 8 to 4: .
- Run. The horizontal value goes from 2 to 6: .
- Divide. . The line falls one unit for each unit it moves right.
Check the sign against the picture: the line falls to the right, so a negative slope makes sense. If you get a positive number for a falling line, you subtracted in different orders.
Slope is not run over rise. Dividing the other way gives the reciprocal, a different number: for a rise of 6 and a run of 30, the slope is , not 5.
Four shapes you will see
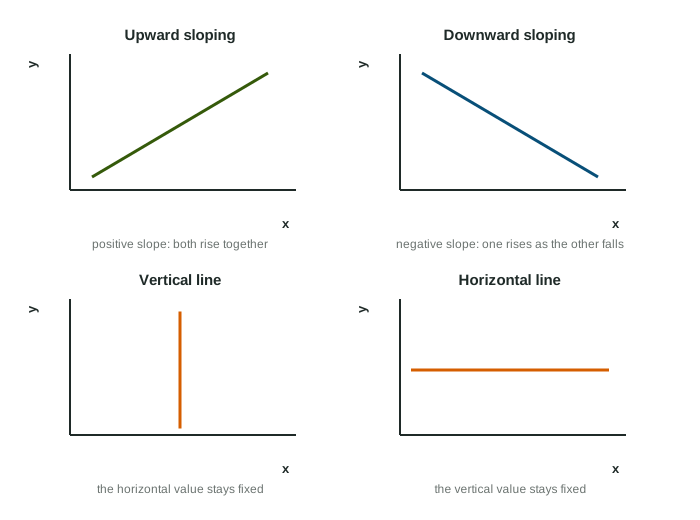
| Shape | Slope | What it says |
|---|---|---|
| Upward sloping | positive | both variables rise together (a direct relationship) |
| Downward sloping | negative | one rises as the other falls (an inverse relationship) |
| Horizontal line | zero | the vertical value stays the same whatever the horizontal value |
| Vertical line | no rise-over-run number (the run is zero) | the horizontal value stays the same whatever the vertical value |
Vertical and horizontal lines matter more than they look. Several graphs in this course have one: a curve that is vertical at one quantity says that quantity does not respond to the variable on the vertical axis at all. When you see one, read it as "this value is fixed".
Straight lines and bowed curves
A straight line has the same slope at every point: pick any two points and you get the same rise over run. A curve does not. A curve that bows outward from the origin starts nearly flat near the vertical axis and gets steeper and steeper as it falls toward the horizontal axis. Its changing slope is the message: each step to the right costs more and more in the vertical direction. You will meet exactly this shape in the next chapter.
Worked example: slope from a table. Buyers want 10 sandwiches at $9, 20 at $7, 30 at $5 and 40 at $3. Price is on the vertical axis.
- Take the first two rows: rise , run .
- Slope : each extra sandwich goes with a price 20 cents lower.
- Any other pair of rows gives the same answer, so the points lie on one straight, downward-sloping line.
Reading points along a curve
Slope also tells you where a point moves when one variable changes. Along an upward-sloping curve, a higher value on the vertical axis comes with a larger value on the horizontal axis: up and to the right. Along a downward-sloping curve, a larger horizontal value comes with a lower vertical value: down and to the right. Exam questions often ask you to place a point on a curve after one value changes; follow the curve's slope.