Geographic Data
Geographic data are tied to places.
Part 1 · Hook
Why this matters
Part 2 · Before you start
What this builds on
Part 3 · Prerequisite check
Quick check before you start
1. What does a reference map show?
- Where things are, such as borders and cities
- One measure, such as income, by shading
- Lines that join points of equal height
- Areas resized by their number of people
Show the answer
Reference maps show locations; the other three are thematic maps.
- Correct: Where things are, such as borders and cities:
- One measure, such as income, by shading:
- Lines that join points of equal height:
- Areas resized by their number of people:
2. A source line reads "UN World Population Prospects 2024". What does it tell you?
- Who made the data and the year
- What the shades mean
- The pattern on the map
- The map scale
Show the answer
A source line gives the maker and the year.
- Correct: Who made the data and the year:
- What the shades mean:
- The pattern on the map:
- The map scale:
Part 4 · See it
See it first
Part 5 · Step by step
How it works, step by step
- A geographer asks a question about a placethe question decides which kind of data is needed
- The question is how much, how many or wherequantitative data from counts, satellites or GPS fit best
- The question is how people see, feel or decidequalitative data from interviews, field notes or documents fit best
- Both kinds are tied to locations and stacked in a GISthe geographer can see where patterns overlap
Part 6 · Key ideas
Key ideas
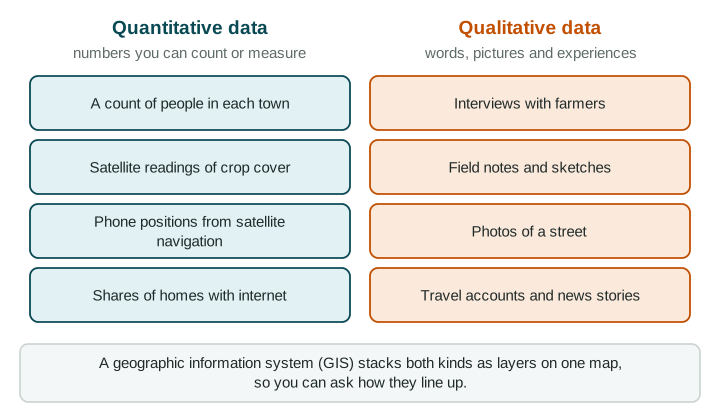
- Geographic data are information tied to a location. They can be quantitative (numbers you count or measure) or qualitative (words, pictures and experiences).
- Field observation means going to a place to record, count, sketch, photograph or interview. It is rich but covers a small area and a short time.
- Remote sensing gathers data from far away, usually by satellite. A satellite navigation system such as GPS finds exact locations.
- A geographic information system (GIS) is software that stacks data as layers on a map, so you can see where they overlap.
Part 7 · Misconception
A common mistake
The wrong idea: Numbers from satellites are always better than people's stories.
What actually happens: Each kind of data answers different questions. Satellites measure what changed across a large area; interviews and field notes explain why and how people experience it.
Part 8 · Check yourself
Check yourself
Exam-style questions. Anything you miss goes into your review queue.
Text
Field notes from a market street (written for practice, LevlPrep 2026)
Saturday, 10 a.m., Market Street, the capital of Country A. I counted 42 stalls between the bus stop and the river. Most sell fruit, phone covers or clothes. Two stall owners told me they moved here last year because the old market was torn down for a parking garage. The street smells of grilled corn, and it is loud with music and bargaining. Shoppers say they come because "everything is cheaper than in the mall."
1. What kind of geographic data are these notes, taken as a whole?
- Mostly qualitative data from field observation and interviews
- Mostly quantitative data, measured from far away by remote sensing
- Positions recorded by a satellite navigation system on a phone
- A thematic map of the market street
Show the answer
Field notes and interviews are qualitative data from field observation: words, impressions and reasons that numbers alone do not capture.
- Correct: Mostly qualitative data from field observation and interviews: Right: the writer watched, listened and asked people questions on the street. Most of what is recorded is words and experiences.
- Mostly quantitative data, measured from far away by remote sensing: Remote sensing gathers data from a distance, such as satellite images. This writer stood on the street.
- Positions recorded by a satellite navigation system on a phone: A satellite navigation system (such as GPS) records positions, not smells, opinions or reasons for moving.
- A thematic map of the market street: These are written notes, not a map.
2. Which detail in the notes is quantitative data?
- The street smells of grilled corn
- There were 42 stalls between the bus stop and the river
- Shoppers say everything is cheaper than in the mall
- Two stall owners moved here because the old market was torn down
Show the answer
Quantitative data are numbers you can count or measure; qualitative data are words, pictures and experiences.
- The street smells of grilled corn: A smell is a sense impression: qualitative.
- Correct: There were 42 stalls between the bus stop and the river: Right: a count is a number, so it is quantitative.
- Shoppers say everything is cheaper than in the mall: An opinion in shoppers' words is qualitative.
- Two stall owners moved here because the old market was torn down: A reason given in an interview is qualitative, even though it mentions two people.
3. The writer wants to show how Market Street connects to bus stops, parking and the river. What would a geographic information system (GIS) add?
- It could replace the interviews by measuring how shoppers feel about prices
- It could take a photo of the street from a satellite each hour
- It could layer the stalls, bus stops, parking and river on one map
- It could count the stalls more accurately than a person can
Show the answer
A GIS is software that layers different data tied to places, so you can see how they line up.
- It could replace the interviews by measuring how shoppers feel about prices: Feelings come from asking people; a GIS can store answers but cannot measure them.
- It could take a photo of the street from a satellite each hour: That describes remote sensing, which a GIS may use as one layer.
- Correct: It could layer the stalls, bus stops, parking and river on one map: Right: a GIS stores data as layers tied to locations, so you can compare them on one map.
- It could count the stalls more accurately than a person can: Counting is done in the field or from images; the GIS combines and maps the results.
4. A delivery driver's phone shows exactly where the truck is on a street map as it moves. Which tool is the phone using?
- Remote sensing from a satellite camera
- A thematic map of the city's traffic
- Field observation by the driver
- A satellite navigation system (such as GPS)
Show the answer
Satellite navigation systems, such as the United States' GPS, give an exact location anywhere with a clear view of the sky.
- Remote sensing from a satellite camera: Remote sensing images the ground; it does not tell a phone where it is.
- A thematic map of the city's traffic: The street map shows where roads are; the location dot comes from satellite navigation.
- Field observation by the driver: Nobody is recording observations; the phone calculates its position.
- Correct: A satellite navigation system (such as GPS): Right: a satellite navigation system works out the receiver's exact location from satellite signals.
5. A city wants to know how residents feel about a new bus line. Which data source fits best?
- Satellite images of the bus routes
- Interviews or open-ended surveys of residents
- A satellite navigation log of where each bus went
- A reference map of the city's streets and bus stops
Show the answer
Match the data to the question: opinions need qualitative sources such as interviews.
- Satellite images of the bus routes: Images show where routes are, not how people feel about them.
- Correct: Interviews or open-ended surveys of residents: Right: feelings and opinions are qualitative, so ask people directly.
- A satellite navigation log of where each bus went: A location log shows where buses went, not what riders think.
- A reference map of the city's streets and bus stops: A street map shows where things are, not opinions.
6. Which of these are qualitative geographic data? Select all that apply.
- A diary kept by a traveler crossing the Sahara
- The share of homes in Seoul with internet access
- The number of cars crossing a bridge each hour
- Average yearly rainfall in Mumbai
Show the answer
Words and pictures (diaries, photos, interviews, news stories) are qualitative; counts and measurements are quantitative.
- Correct: A diary kept by a traveler crossing the Sahara: Right: a diary records experiences in words.
- The share of homes in Seoul with internet access: A share is a number (a percent): quantitative.
- The number of cars crossing a bridge each hour: A count of cars is a number: quantitative.
- Average yearly rainfall in Mumbai: An average of measurements is a number: quantitative.
7. A student studies street life in Seoul by reading travel blogs and watching videos posted by visitors. What is a weakness of these sources?
- They show what visitors chose to record, so they may miss residents' daily life
- They are quantitative counts, so they leave out what the street is like to be on
- They come from the field, so they are less useful than a map of the same streets
- They are remote sensing data taken from space, so they lack street-level detail
Show the answer
Qualitative sources carry the writer's point of view. Ask whose view it is and what it leaves out.
- Correct: They show what visitors chose to record, so they may miss residents' daily life: Right: travel accounts are shaped by who wrote them and what they found interesting.
- They are quantitative counts, so they leave out what the street is like to be on: Blogs and videos are qualitative, not quantitative.
- They come from the field, so they are less useful than a map of the same streets: Field sources can be very useful; the issue is whose view they give.
- They are remote sensing data taken from space, so they lack street-level detail: They are not remote sensing; they were made by people on the ground.
Part 9 · Summary
Summary
Part 10 · Up next
What comes next
Part 11 · Connections