Energy Flow and the 10% Rule
Energy enters ecosystems through producers and flows one way, up the trophic levels.
Part 1 · Hook
Why this matters
Part 2 · Before you start
What this builds on
Part 3 · Prerequisite check
Quick check before you start
1. What is the trophic level of a herbivore?
- Primary consumer (level 2)
- Producer (level 1)
- Secondary consumer (level 3)
- Apex predator
Show the answer
Herbivores eat producers.
- Correct: Primary consumer (level 2):
- Producer (level 1):
- Secondary consumer (level 3):
- Apex predator:
2. Which setup gives what percent 650 is of 2,500?
- 650 / 2500 × 100
- 2500 / 650 × 100
- (2500 - 650) / 650 × 100
- 650 × 2500 / 100
Show the answer
Part over whole, times 100.
- Correct: 650 / 2500 × 100:
- 2500 / 650 × 100:
- (2500 - 650) / 650 × 100:
- 650 × 2500 / 100:
3. NPP is...
- GPP minus plant respiration
- GPP plus plant respiration
- the energy reaching the top predator
- the sunlight hitting a field
Show the answer
NPP = GPP - R.
- Correct: GPP minus plant respiration:
- GPP plus plant respiration:
- the energy reaching the top predator:
- the sunlight hitting a field:
Part 4 · See it
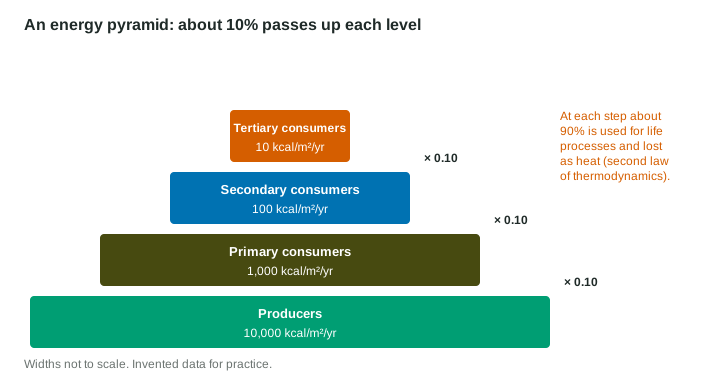
See it first
Part 5 · Step by step
How it works, step by step
- Organisms at each level use most of their food energy for respiration and body heatthat energy leaves as heat and cannot be passed on
- Some of each level is never eaten, or is lost in wastethat energy goes to decomposers instead
- Only about 10% is stored as new tissueabout 10% is available to the next level up, so energy shrinks at every step
Part 6 · Key ideas
Key ideas
- The 10% rule: about 10% of the energy at one trophic level reaches the next. Multiply by 0.10 for each step up.
- The first law of thermodynamics: energy is not created or destroyed. The second law: every transfer turns some into heat, so no transfer is 100% efficient.
- An energy pyramid always narrows going up; biomass pyramids usually do too.
- Transfer efficiency = energy at the higher level ÷ energy at the lower level × 100.
Part 7 · Misconception
A common mistake
The wrong idea: Energy is used up or destroyed as it moves up the trophic levels.
What actually happens: Energy is not destroyed (first law). It changes form, and at each step most of it becomes heat released to the surroundings (second law), which organisms cannot use as food.
Part 8 · Check yourself
Check yourself
Exam-style questions. Anything you miss goes into your review queue.
1. Producers in a meadow store 20,000 kcal/m²/yr. Using the 10% rule, about how much energy reaches the secondary consumers?
Type a number, then its unit (kcal/m^2/yr). Scale words (2.5 million) and powers of ten (2.5 × 10^6) are read.
Show the answer
Two steps up (producers → primary → secondary): kcal/m²/yr.
- Answer: 200 kcal/m^2/yr
2. Primary consumers in a forest store 3,000 kcal/m²/yr. Write the setup for the energy reaching tertiary consumers by the 10% rule, then give the answer.
Type the setup as on the exam, with brackets and units, then the answer.
Show the answer
Primary → secondary → tertiary is two steps: kcal/m²/yr.
- Setup: ; answer 30 kcal/m^2/yr
Data
Energy at each trophic level in a lake
| Trophic level | Organisms | Energy (kcal/m²/yr) |
|---|---|---|
| 1: producers | algae | 8,000 |
| 2: primary consumers | zooplankton | 880 |
| 3: secondary consumers | small fish | 80 |
| 4: tertiary consumers | bass | 7 |
3. What percent of the producers’ energy is passed to the primary consumers?
Type a number, then its unit (%). Scale words (2.5 million) and powers of ten (2.5 × 10^6) are read.
Show the answer
.
- Answer: 11 %
4. What is the transfer efficiency from small fish to bass, as a percent?
Type a number, then its unit (%). Scale words (2.5 million) and powers of ten (2.5 × 10^6) are read.
Show the answer
, close to the 10% rule.
- Answer: 8.75 %
5. Which statement do the data support?
- Each transfer is close to 10%.
- Each level holds about half the energy of the level below.
- Energy increases at the higher trophic levels.
- The bass get about 10% of the producers’ energy.
Show the answer
Efficiencies: 880/8,000 = 11%; 80/880 = 9.1%; 7/80 = 8.75%. All near 10%.
- Correct: Each transfer is close to 10%.: Right: each step is close to 10%.
- Each level holds about half the energy of the level below.: Each level holds about a tenth, not half.
- Energy increases at the higher trophic levels.: Energy falls at each level.
- The bass get about 10% of the producers’ energy.: Bass get 7/8,000, about 0.09% of the producers’ energy.
6. What percent of the producers’ energy reaches the bass?
Type a number, then its unit (%). Scale words (2.5 million) and powers of ten (2.5 × 10^6) are read.
Show the answer
- Answer: 0.0875 %
Model or diagram
Biomass at each level in a grassland
7. Which pattern does the biomass chart show?
- It falls sharply at each level.
- It rises at each higher trophic level.
- Each level has about the same biomass.
- Grazers have more biomass than grasses.
Show the answer
1,500 → 120 → 11 → 1.5 g/m²: roughly a tenth or less at each step.
- Correct: It falls sharply at each level.: Right: a sharp drop each step.
- It rises at each higher trophic level.: The bars get shorter going up.
- Each level has about the same biomass.: The bars differ greatly.
- Grazers have more biomass than grasses.: Grasses (1,500) far exceed grazers (120).
Part 9 · Summary
Summary
Part 10 · Up next
What comes next
Part 11 · Connections