An exponential model, , says the growth rate is proportional to the population, so the population grows without bound. That fits a small population with plenty of food and space, but not a crowded one. A logistic model adds a brake: as the population nears the most the environment can support, its growth slows to zero.
The logistic differential equation
In a logistic model the rate of change is jointly proportional to the population and to the room left, :
The same model is often written , with . In both forms, is the carrying capacity: the positive value of at which the rate is 0. To read , set the rate equal to 0 and take the positive solution.
| Equation | Carrying capacity | Fastest growth at |
|---|---|---|
| 1200 | ||
| 2500 | ||
| 7 |
Reading the model without solving it
The equilibrium solutions are and . The sign of tells what happens from any other starting value:
- : the rate is positive, so increases toward , never reaching it.
- : the factor is negative, so decreases toward .
- In both cases .
The questions on this topic ask you to interpret the equation: its carrying capacity, its limit, where growth is fastest, what a rate means in context. Solving the equation for a formula is not needed.
Worked example 1. Fish in a lake satisfy
(a) The rate is 0 at , and , so
(b)
(c) Half the carrying capacity: 600 fish.
Why growth is fastest at half the carrying capacity
As a function of , the rate
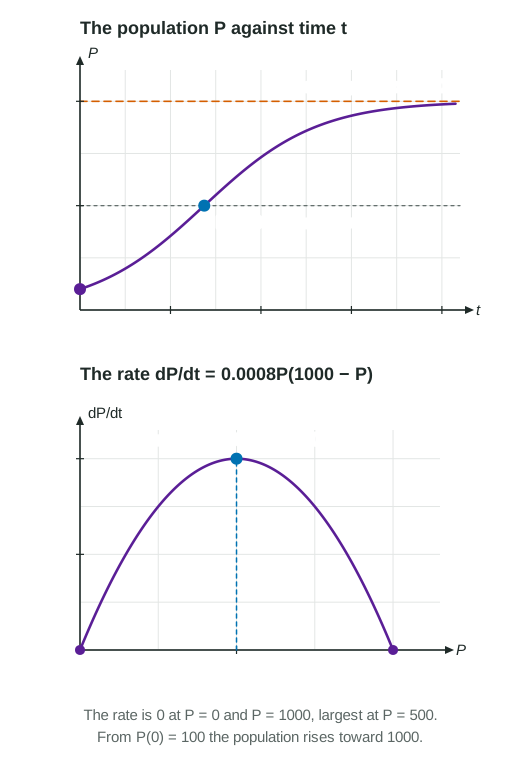
The same fact gives the concavity of . By the chain rule,
For a population rising from below , , so the graph of is concave up while and concave down while . The population at is a point of inflection: growth is fastest there.
Worked example 2. In a school of 5000 students, the number who have heard a rumor satisfies
Fastest at students, half the carrying capacity. The rate then is
In context: when half the school has heard the rumor, it is spreading at 1250 students per hour, faster than at any other time.
Logistic compared with exponential
| Exponential, | Logistic, | |
|---|---|---|
| Rate proportional to | and , jointly | |
| Long run | grows without bound | approaches |
| Fastest growth | keeps increasing | at |
| Shape of the graph of | concave up | S-shaped: up, then down |
For a small population the two models nearly agree, since and the logistic rate is close to .