95% confidence intervals and error bars
A 95% confidence interval, about x̄ ± 2SE, is a range that very probably contains the true mean; drawn on a graph it becomes an error bar.
Part 1 · Hook
Why this matters
Two bars on a graph: 0.46 and 0.62. The second is taller, but is it really different, or would another eight beet cubes flip the order? Error bars answer that at a glance, and on the exam you will be asked both to draw them and to say what they show.
Part 2 · Before you start
What this builds on
Part 3 · Prerequisite check
Quick check before you start
1. What is the standard error of a mean with s = 0.30 and n = 9?
- 0.10
- 0.03
- 0.90
Show the answer
SE = s ÷ √n = 0.30 ÷ 3 = 0.10.
- Correct: 0.10:
- 0.03:
- 0.90:
2. What does a selectively permeable membrane do?
- Lets some substances cross easily while blocking or slowing others
- Lets every dissolved substance cross at the same speed
- Blocks water while letting large charged molecules through
Show the answer
The hydrophobic core and specific proteins let small nonpolar molecules (and water through aquaporins) cross, while large or charged molecules are held back.
- Correct: Lets some substances cross easily while blocking or slowing others:
- Lets every dissolved substance cross at the same speed:
- Blocks water while letting large charged molecules through:
3. An experiment shows a difference far larger than chance variation. What do you do with the null hypothesis?
- Reject it
- Accept it
- Prove it
Show the answer
A difference too large to blame on chance leads you to reject the null hypothesis.
- Correct: Reject it:
- Accept it:
- Prove it:
Part 4 · See it
See it first
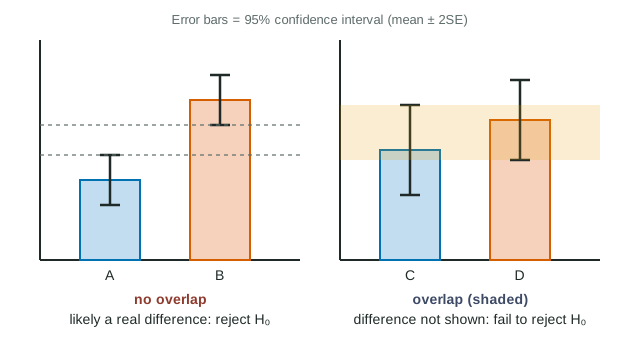
Part 5 · Step by step
How it works, step by step
- A sample mean is only an estimate of the true mean, and its uncertainty is measured by SE = s ÷ √n.You can build a range around it that very probably contains the true mean.
- About 95% of sample means fall within 2 standard errors of the true mean.The interval x̄ ± 2SE is an approximate 95% confidence interval.
- You draw that interval as an error bar on each plotted mean.A reader can see how precisely each mean is known.
- Two groups' 95% CI error bars do not overlap.The difference is unlikely to be chance: it is statistically significant, and you reject the null hypothesis.
- Two groups' bars overlap.The data do not show a difference, so you fail to reject the null; more data could still reveal one.
Part 6 · Key ideas
Key ideas
- Worked example. 15 °C: n = 9, x̄ = 1.8, s = 0.30, SE = 0.10, CI = 1.6-2.0. 25 °C: n = 9, x̄ = 2.5, s = 0.36, SE = 0.12, CI = 2.26-2.74. No overlap: likely a real difference.
- Formula sheet: SE = s ÷ √n; 95% CI ≈ x̄ ± 2SE. A bigger sample gives a smaller SE and a narrower interval.
- Overlap rule (95% CI bars only): no overlap, likely a real difference; overlap, the data do not show one. Overlap never proves the means are equal.
- Always say what your error bars show (SD, SE or 95% CI). The same picture means different things for each.
Part 7 · Misconception
A common mistake
The wrong idea: If two 95% confidence interval error bars overlap, the two means are the same.
What actually happens: Overlap means only that the data do not show a difference at this level of confidence. A real difference can hide behind overlapping bars, especially with small samples.
Part 8 · Check yourself
Check yourself
Exam-style questions. Anything you miss goes into your review queue.
Graph
Leakage from heated beet cubes
Beet cells hold a red, water-soluble substance behind selectively permeable membranes. Cubes were heated for 1 minute at four temperatures and then soaked for 20 minutes in water; the absorbance of the water measures how much red substance leaked. Bars show means; error bars show 95% confidence intervals (mean ± 2SE), n = 8 cubes per temperature.
Data table
| Heating temperature | Mean absorbance (± error) |
|---|---|
| 20 °C | 0.08 ± 0.03 |
| 40 °C | 0.1 ± 0.04 |
| 60 °C | 0.46 ± 0.06 |
| 70 °C | 0.62 ± 0.12 |
1. Select ALL pairs of temperatures whose means are likely different, based on the error bars.
- 20 °C and 40 °C
- 40 °C and 60 °C
- 60 °C and 70 °C
- 20 °C and 70 °C
Show the answer
Intervals: 20 °C, 0.05-0.11; 40 °C, 0.06-0.14; 60 °C, 0.40-0.52; 70 °C, 0.50-0.74. Bars that do not overlap (40 vs 60, 20 vs 70) point to real differences.
- 20 °C and 40 °C: Overlap (0.06-0.11 is shared), so the data do not show a difference.
- Correct: 40 °C and 60 °C: No overlap: 40 °C tops out at 0.14; 60 °C starts at 0.40.
- 60 °C and 70 °C: Overlap: 60 °C reaches 0.52 and 70 °C starts at 0.50, so the data do not show a difference.
- Correct: 20 °C and 70 °C: No overlap: 0.11 versus 0.50.
2. The 70 °C mean is 0.16 higher than the 60 °C mean. Which conclusion is best supported?
- The data do not show a difference between 60 °C and 70 °C, because the error bars overlap; a larger sample might reveal one.
- Heating to 70 °C caused more leakage than 60 °C, because the 70 °C mean is higher by 0.16 absorbance units.
- Heating to 70 °C caused the same leakage as 60 °C, because overlapping error bars prove the means are equal.
- No conclusion is possible about any of the temperatures, because the 70 °C error bar is the widest of the four bars on the graph.
Show the answer
The 60 °C interval (0.40-0.52) and the 70 °C interval (0.50-0.74) overlap, so the difference is not clearly larger than chance variation. Overlap means "not shown", not "shown to be equal".
- Correct: The data do not show a difference between 60 °C and 70 °C, because the error bars overlap; a larger sample might reveal one.: Correct: overlap means fail to reject the null hypothesis for this pair.
- Heating to 70 °C caused more leakage than 60 °C, because the 70 °C mean is higher by 0.16 absorbance units.: A higher mean is not enough when the intervals overlap.
- Heating to 70 °C caused the same leakage as 60 °C, because overlapping error bars prove the means are equal.: Overlap does not prove equality; it means the data cannot distinguish the means.
- No conclusion is possible about any of the temperatures, because the 70 °C error bar is the widest of the four bars on the graph.: A wide bar affects comparisons with that group, not every comparison on the graph.
3. The 70 °C error bar is ± 0.12 and represents ± 2SE. With n = 8, what is the standard deviation of the 70 °C absorbances? Give your answer to two decimal places.
Type a number.
Show the answer
2SE = 0.12, so SE = 0.06. SE = s ÷ √n, so s = SE × √n = 0.06 × √8 = 0.06 × 2.83 = 0.17.
- Answer: 0.17
4. Which explanation best accounts for the large increase in leakage between 40 °C and 60 °C?
- Above about 40 °C, heat disrupts the bilayer and denatures membrane proteins, so the membrane stops being a selective barrier.
- Above 40 °C, the red substance becomes small and nonpolar, so it passes through an intact bilayer by simple diffusion.
- Above 40 °C, aquaporins open wider and let the red substance pass through them along with the water molecules.
- Above 40 °C, the cell walls dissolve, and the cell wall is the structure that keeps the red substance in the cell.
Show the answer
Selective permeability depends on an intact bilayer and properly folded proteins. Heat loosens the hydrophobic core and unfolds proteins, so large water-soluble molecules leak out.
- Correct: Above about 40 °C, heat disrupts the bilayer and denatures membrane proteins, so the membrane stops being a selective barrier.: Correct: a damaged barrier loses selectivity.
- Above 40 °C, the red substance becomes small and nonpolar, so it passes through an intact bilayer by simple diffusion.: Heating does not change the substance's polarity in this way; the change is in the membrane.
- Above 40 °C, aquaporins open wider and let the red substance pass through them along with the water molecules.: Aquaporins are selective for water; they do not pass large solutes even when the cell is warm.
- Above 40 °C, the cell walls dissolve, and the cell wall is the structure that keeps the red substance in the cell.: The cell wall is porous and gives support; the membrane is the barrier to dissolved molecules.
5. Why is the 70 °C error bar wider than the 20 °C error bar?
- The 70 °C cubes varied more from one another, so the standard error of their mean is larger.
- More cubes were tested at 70 °C, and testing more cubes tends to make an error bar wider.
- The 70 °C mean is larger, and a larger mean comes with a proportionally wider error bar.
- Error bars get wider as temperature rises, whatever the data, because heat adds uncertainty.
Show the answer
With the same n = 8, the width of a ±2SE bar depends on the standard deviation. Cubes heated to 70 °C were damaged to differing degrees, so their values spread more.
- Correct: The 70 °C cubes varied more from one another, so the standard error of their mean is larger.: Correct.
- More cubes were tested at 70 °C, and testing more cubes tends to make an error bar wider.: Every group had n = 8, and more data make the bar narrower, not wider.
- The 70 °C mean is larger, and a larger mean comes with a proportionally wider error bar.: Bar width depends on spread and n, not on the size of the mean.
- Error bars get wider as temperature rises, whatever the data, because heat adds uncertainty.: Bar width comes from the data's spread, not from the temperature itself.
Data table
Membrane fluidity at three temperatures
Researchers measured how fast a labeled lipid moved sideways in artificial membranes (faster means more fluid) at three temperatures.
| Temperature (°C) | Number of membranes, n | Mean (µm²/s) | Standard deviation (µm²/s) |
|---|---|---|---|
| 15 | 9 | 1.8 | 0.30 |
| 25 | 9 | 2.5 | 0.36 |
| 35 | 4 | 3.0 | 0.60 |
6. Using 95% confidence intervals (x̄ ± 2SE), which comparison shows a likely real difference?
- 15 °C and 25 °C: the intervals 1.6-2.0 and 2.26-2.74 do not overlap.
- 25 °C and 35 °C: the 35 °C mean is 0.5 higher than the 25 °C mean.
- Both comparisons, because fluidity rises steadily from each temperature to the next.
- Neither comparison, because the 35 °C group has fewer membranes than the other groups.
Show the answer
15 °C: 1.8 ± 0.20 = 1.6-2.0. 25 °C: 2.5 ± 0.24 = 2.26-2.74. 35 °C: SE = 0.60 ÷ √4 = 0.30, so 3.0 ± 0.60 = 2.4-3.6, which overlaps 25 °C.
- Correct: 15 °C and 25 °C: the intervals 1.6-2.0 and 2.26-2.74 do not overlap.: Correct: no overlap between 15 and 25 °C.
- 25 °C and 35 °C: the 35 °C mean is 0.5 higher than the 25 °C mean.: The 35 °C interval (2.4-3.6) overlaps the 25 °C interval, so this difference is not shown.
- Both comparisons, because fluidity rises steadily from each temperature to the next.: A rising trend in means is not enough; the 25-35 °C intervals overlap.
- Neither comparison, because the 35 °C group has fewer membranes than the other groups.: A small n widens the 35 °C interval, but it does not affect the 15-25 °C comparison.
7. Group P: mean 5.0, 95% CI 4.6-5.4. Group Q: mean 5.5, 95% CI 5.3-5.7. A student says, "The bars overlap, so the treatment had no effect." What is the best evaluation?
- Too strong: overlap means the data do not show a difference, not that there is none; overlapping 95% CIs can still hide a real one.
- Correct: overlapping 95% confidence intervals prove that the two population means are equal.
- Incorrect: Q's interval is narrower, so Q's data are more reliable, and its higher mean therefore shows a clear effect of the treatment.
- Incorrect: the means differ by 0.5, which is larger than the width of Q's interval, so they differ.
Show the answer
Overlap of 95% CIs means the data are not enough to show a difference at that level of confidence. Slight overlap is common even when a formal test would find a difference, which is why "no effect" overstates it.
- Correct: Too strong: overlap means the data do not show a difference, not that there is none; overlapping 95% CIs can still hide a real one.: Correct: "not shown" is not "shown not".
- Correct: overlapping 95% confidence intervals prove that the two population means are equal.: Confidence intervals never prove means are equal.
- Incorrect: Q's interval is narrower, so Q's data are more reliable, and its higher mean therefore shows a clear effect of the treatment.: A narrower interval does not make a higher mean significant on its own.
- Incorrect: the means differ by 0.5, which is larger than the width of Q's interval, so they differ.: The comparison is overlap between intervals, not the gap against one interval's width.
Part 9 · Summary
Summary
A 95% confidence interval, about x̄ ± 2SE, is a range that very probably contains the true mean; drawn on a graph it becomes an error bar. If two groups' 95% CI bars do not overlap, the difference is statistically significant and the null hypothesis is rejected. If they overlap, the data do not show a difference, which is not the same as showing there is none. Larger samples narrow the intervals. Always label what error bars represent.
Part 10 · Up next
What comes next
Part 11 · Connections