Why one measurement is never enough
Put a coin on a table and add water one drop at a time. The water piles up into a dome, held together by the hydrogen bonds between water molecules at the surface, until it finally spills. Count the drops and you might get 31. Dry the coin and do it again: 28. Again: 33. The coin did not change; small differences in drop size, how steady your hand was and where each drop landed changed the count.
This happens in every experiment. Repeated measurements of the same thing vary, so the honest result is not one number but a sample: the set of values you actually collected. The number of values in it is the sample size, written n. To report a sample you need two kinds of summary: where its values are centered, and how spread out they are.
Worked example: mean, median, mode and range
Data: drops held on a coin with plain water, measured eight times: 31, 28, 33, 30, 29, 35, 30, 32 drops.
Mean (add, then divide by n): x̄ = Σx ÷ n = (31 + 28 + 33 + 30 + 29 + 35 + 30 + 32) ÷ 8 = 248 ÷ 8 = 31.0 drops.
Median (sort, then take the middle): 28, 29, 30, 30, 31, 32, 33, 35. With 8 values there are two middle values, the 4th (30) and the 5th (31). Median = (30 + 31) ÷ 2 = 30.5 drops.
Mode (most frequent value): 30 appears twice, every other value once. Mode = 30 drops.
Range (largest − smallest): 35 − 28 = 7 drops.
On the exam's formula sheet the mean is written x̄ = (1/n) Σ xi: the symbol Σ ("sigma") means "add up all of them".
Mean or median? What an outlier does
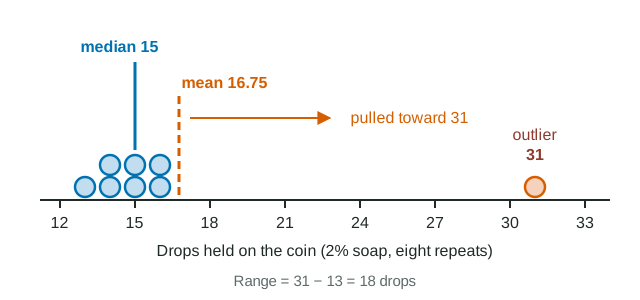
Now add soap to the water. Soap molecules crowd between water molecules at the surface, fewer hydrogen bonds hold the surface together, and the dome breaks sooner. One group got 14, 16, 13, 15, 31, 14, 16, 15 drops. Seven values sit between 13 and 16, and one is 31 (see the dot plot).
- The mean is 134 ÷ 8 = 16.75 drops. Every value adds to the sum, so the 31 adds far more than the others and drags the mean above seven of the eight values.
- The median is the average of the 4th and 5th sorted values: (15 + 15) ÷ 2 = 15 drops. It depends only on position, so the 31 could be 310 and the median would not move.
A value far from the rest is an outlier. When a data set has an outlier, or is lopsided with a long tail on one side, the median describes a typical value better than the mean. When the data are roughly symmetric, the two are close and the mean is usually reported because it uses all the information.
| Summary | How to find it | Effect of one outlier | Best used when |
|---|---|---|---|
| Mean | Sum ÷ n | Pulled strongly toward it | Data roughly symmetric, no outliers |
| Median | Middle of sorted data | Barely moves | Outliers or lopsided data |
| Mode | Most frequent value | None (unless the outlier repeats) | Counts or categories with a clear favorite |
What to do with an outlier
An outlier is a question, not an answer. First check for a mistake: a copying error (31 written for 13), a dirty coin, a dropper that was swapped. If you find one, correct or remove the value and say so. If you find nothing, the value is real data. Keep it, report it, and give the median as well as the mean so a reader sees its effect. Deleting a value because it is inconvenient makes your results look more consistent than they were.
Spread: the range and why it matters
Two groups each report a mean of 25 drops. Group P got 24, 25, 25, 26, 25; group Q got 18, 31, 25, 22, 29. The centers match, but P's range is 26 − 24 = 2 drops and Q's is 31 − 18 = 13 drops. Q's measurements are far less consistent, so any single Q value could land well away from 25. A center without a spread hides this, so always report both.
The range is quick but uses only two values, so a single outlier inflates it (the 2% soap data have a range of 31 − 13 = 18 drops, mostly because of one value). Later skills replace it with measures of spread that use every value.
Types of data
| Type | What it is | Examples | Can you average it? |
|---|---|---|---|
| Quantitative, discrete | Counted in whole units | Drops on a coin, number of seeds | Yes |
| Quantitative, continuous | Measured on a scale | Mass (g), time (s), temperature (°C) | Yes |
| Qualitative (categorical) | Names or categories | Color, spilled or not | No; count each category instead |
A mean of counted drops can be a decimal (31.0, 16.75) even though each count is whole: the mean describes the sample, not one measurement.