The problem: chance makes groups differ
Beet cells keep a red, water-soluble substance behind a membrane. Heat a beet cube, put it in water, and the membrane's damage shows up as red water. A student heats four cubes at 20 °C and four at 40 °C and gets mean absorbances of 0.08 and 0.09. The 40 °C mean is higher. Did the extra heat do it?
Not necessarily. Measurements vary by chance even when nothing changes: four cubes at the same temperature gave 0.05, 0.09, 0.07 and 0.11. Two groups will almost never have exactly equal means, so "the means are different" is not evidence on its own. Hypothesis testing is the method for deciding when a difference is big enough to take seriously.
Worked example: stating and testing hypotheses
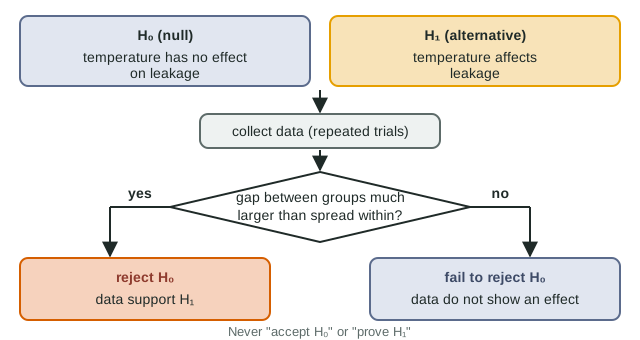
Question: does heating temperature affect how much red color leaks from beet cubes?
Null hypothesis (H₀): heating temperature has no effect on the amount of red color that leaks.
Alternative hypothesis (H₁): heating temperature affects the amount that leaks. Directional version: higher heating temperatures increase the amount that leaks.
| Temperature (°C) | Values | Mean | Range |
|---|---|---|---|
| 20 | 0.05, 0.09, 0.07, 0.11 | 0.08 | 0.06 |
| 40 | 0.06, 0.12, 0.08, 0.10 | 0.09 | 0.06 |
| 80 | 0.88, 0.95, 0.81, 0.92 | 0.89 | 0.14 |
20 vs 40 °C: the means differ by 0.01, but each group spreads over 0.06 and the values overlap almost completely. Chance could easily produce this gap. Fail to reject H₀.
20 vs 80 °C: the lowest 80 °C value (0.81) is about seven times the highest 20 °C value (0.11). A gap this large is very unlikely if temperature had no effect. Reject H₀; the data support H₁.
Why test "no effect"?
The null hypothesis makes a sharp prediction: groups should differ only by about as much as chance variation. That gives you something to measure the data against. The alternative ("there is some effect") is too open-ended to check directly. So you assume the null and ask whether the data are too extreme for it to be believable. Later skills turn "too extreme" into numbers; here you judge by comparing the gap between groups with the spread within them.
The language: what you can and cannot say
| Say this | Not this | Why |
|---|---|---|
| Reject the null hypothesis | Prove the alternative | Data make a hypothesis more or less believable; they never prove it. |
| Fail to reject the null hypothesis | Accept the null hypothesis | Not finding an effect is not the same as showing there is none. |
| The data support the alternative | The alternative is true | A later experiment could still disagree. |
| The data do not show an effect | There is no effect | A small effect, too few repeats or noisy data can hide a real one. |
A second example: cholesterol and fluidity
Membranes stiffen in the cold as phospholipid tails pack tightly. A team made artificial membranes with and without cholesterol and measured, at 10 °C, how fast a labeled lipid moved sideways (faster means more fluid). Six membranes of each type: without cholesterol, values 1.9 to 2.3 µm²/s (mean 2.1); with cholesterol, 2.7 to 3.1 µm²/s (mean 2.9).
- H₀: cholesterol has no effect on membrane fluidity at 10 °C.
- H₁: cholesterol changes membrane fluidity at 10 °C.
- Decision: the groups do not overlap and the gap (0.8) is twice the range of either group: reject H₀.
- Mechanism: cholesterol's rigid rings wedge between phospholipids and stop their tails from packing tightly in the cold, so the membrane stays more fluid.
Writing hypotheses that score
- Name both variables: "[independent variable] has no effect on [dependent variable]."
- Keep the null free of direction and explanation. "Heat damages membranes" is an explanation, not a null.
- Write the alternative as the opposite of the null, adding a direction if the question asks for one.