Population Ecology
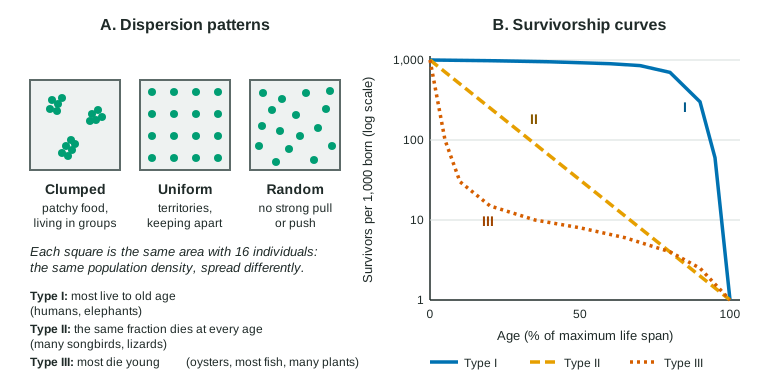
A population is described by its density (individuals per unit area) and its dispersion (clumped, uniform or random).
Part 1 · Hook
Why this matters
In 1937, eight pheasants were released on a small island off the coast of Washington State, with plenty of food and no foxes. Five years later there were close to 2,000. The birds did not change; their numbers did, because every new bird soon added young of its own. The same arithmetic explains why a few rabbits can overrun a continent and why bacteria in a warm lunch box become millions by noon.
Part 2 · Before you start
What this builds on
Part 3 · Prerequisite check
Quick check before you start
1. A population grows from 200 to 260 individuals in 2 years. What is its average rate of change?
- 30 individuals per year
- 60 individuals per year
- 130 individuals per year
Show the answer
Rate = change ÷ time = (260 − 200) ÷ 2 years = 30 individuals per year.
- Correct: 30 individuals per year:
- 60 individuals per year:
- 130 individuals per year:
2. An individual's fitness is measured by
- how many of its offspring survive to reproduce
- how long it lives
- how large and strong it is
Show the answer
Fitness is reproductive success: offspring that themselves survive and reproduce.
- Correct: how many of its offspring survive to reproduce:
- how long it lives:
- how large and strong it is:
3. Five quadrats contain 2, 4, 3, 5 and 6 plants. What is the mean number per quadrat?
- 4
- 3
- 20
Show the answer
Mean = sum ÷ n = 20 ÷ 5 = 4 plants per quadrat.
- Correct: 4:
- 3:
- 20:
Part 4 · See it
See it first
Part 5 · Step by step
How it works, step by step
- Births and immigrants add individuals to a population; deaths and emigrants remove them.The population size N changes at a rate dN/dt; with no migration, dN/dt = B − D.
- Each individual has a certain chance of giving birth and of dying in a given time.Dividing (B − D) by N gives the per capita growth rate; under ideal conditions it reaches its highest value, r_max.
- While food and space are plentiful, the per capita rate stays near r_max, so dN/dt = r_max N.The more individuals there are, the more are added each period: growth speeds up even though the per capita rate stays the same.
- Growth that adds a constant fraction each period keeps doubling in equal times.N plotted against time makes a J-shaped curve: exponential growth.
- Species that breed young and have many offspring each time have a high r_max.Their numbers rebound quickly after a crash; species that breed late and have few young grow and recover slowly.
- Survival also differs with age: some species lose most young, others lose few until old age.Survivorship curves (Types I, II and III) show this pattern, which matches how much parents invest in each offspring.
Part 6 · Key ideas
Key ideas
- Population density is individuals per unit area; dispersion is how they are spaced: clumped, uniform or random.
- Demography tracks births, deaths and migration. Formula sheet: dN/dt = B − D; per capita rate = (B − D) ÷ N.
- Exponential growth: dN/dt = r_max N. A constant per capita rate times a growing N gives a J-shaped curve.
- Life history: r-selected species (early, many, small offspring, little care) have a high r_max; K-selected species (late, few, large offspring, much care) a low one. Semelparity is breeding once; iteroparity is breeding many times.
- Survivorship curves: Type I (most live to old age), Type II (same fraction dies at every age), Type III (most die young).
Part 7 · Misconception
A common mistake
The wrong idea: In exponential growth a population adds the same number of individuals every year.
What actually happens: It adds the same fraction every year. Because N keeps getting bigger, the number added each year keeps getting bigger too: 100 rabbits growing 50% a year add 50, then 75, then 112.
Part 8 · Check yourself
Check yourself
Exam-style questions. Anything you miss goes into your review queue.
Graph
Survivorship of three species
Ecologists followed 1,000 newborns of each of three species until all had died and recorded how many were alive at each age. Age is given as a percentage of the species' maximum life span. The y-axis shows the log₁₀ of the number of survivors, so 3 means 1,000 survivors, 2 means 100, 1 means 10 and 0 means 1.
Species P (a large mammal)Species Q (a songbird)Species R (a marine fish)
Data table
| Age (% of maximum life span) | Species P (a large mammal) | Species Q (a songbird) | Species R (a marine fish) |
|---|---|---|---|
| 0 | 3 | 3 | 3 |
| 10 | 2.99 | 2.7 | 1.3 |
| 20 | 2.98 | 2.4 | 1 |
| 30 | 2.97 | 2.1 | 0.9 |
| 40 | 2.95 | 1.8 | 0.8 |
| 50 | 2.93 | 1.5 | 0.7 |
| 60 | 2.9 | 1.2 | 0.6 |
| 70 | 2.8 | 0.9 | 0.5 |
| 80 | 2.6 | 0.6 | 0.4 |
| 90 | 2 | 0.3 | 0.2 |
| 100 | 0 | 0 | 0 |
1. How many of the 1,000 species Q newborns are still alive at 50% of the maximum life span? Give a whole number.
Type a number in individuals.
Show the answer
At 50% the value is 1.5, so survivors = 10^1.5 = 31.6, about 32 of the 1,000. A log value of 1.5 lies between 10 (log 1) and 100 (log 2), but not halfway in actual numbers.
- Answer: 32 individuals
2. Species Q's curve is a straight line on this log scale, falling by 0.3 in every 10% of the life span. What does that mean about deaths in species Q?
- About half of those alive at the start of each interval die during it, at every age.
- The same number of birds, about 100, die in each 10% of the life span.
- Death is most likely in old age, because the curve reaches 0 at 100% of the life span.
- Deaths are spread evenly, so as many die in the first 10% as in the last 10%.
Show the answer
On a log scale, equal drops are equal fractions. A drop of 0.3 means survivors are multiplied by 10^−0.3 ≈ 0.5 each interval: about half of those still alive die, whatever their age.
- Correct: About half of those alive at the start of each interval die during it, at every age.: Correct: a constant fraction (about 50%) dies in each interval.
- The same number of birds, about 100, die in each 10% of the life span.: Numbers dying shrink as survivors shrink: about 500 in the first interval (1,000 to 501) but only about 1 in the last (2 to 1).
- Death is most likely in old age, because the curve reaches 0 at 100% of the life span.: The chance of dying is the same at every age; a straight log line has no late steep drop.
- Deaths are spread evenly, so as many die in the first 10% as in the last 10%.: About 500 die in the first 10% and about 1 in the last 10%, far from equal numbers.
Data table
Flour beetles in a large container of fresh flour
A student added 200 adult flour beetles to a large container with far more flour than they could eat, kept at 30 °C. Every week the student counted the beetles and recorded the births (new adults) and deaths during the week. The flour was replaced each week, so food never ran short.
| Week | Beetles at start of week (N) | Births during week (B) | Deaths during week (D) |
|---|---|---|---|
| 1 | 200 | 130 | 30 |
| 2 | 300 | 195 | 45 |
| 3 | 450 | 293 | 68 |
| 4 | 675 | 439 | 101 |
| 5 | 1,013 | 658 | 152 |
3. Use dN/dt = B − D to calculate the population growth rate during week 3, in beetles per week. Give a whole number.
Type a number in beetles per week.
Show the answer
dN/dt = B − D = 293 − 68 = 225 beetles per week. Check: week 4 starts with 450 + 225 = 675 beetles.
- Answer: 225 beetles per week
4. Calculate the per capita growth rate during week 3, in per week. Give your answer to two decimal places.
Type a number in per week.
Show the answer
Per capita rate = (B − D) ÷ N = 225 ÷ 450 = 0.50 per week: each week the population adds half its size.
- Answer: 0.50 per week
5. Which statement about weeks 1 to 5 is supported by the data?
- The per capita growth rate rises each week, so the population grows faster and faster.
- The number added each week stays at about 100 beetles, as in linear growth.
- The number added each week rises while the per capita rate stays at 0.50: exponential growth.
- Both the number added and the per capita rate fall as the container fills with beetles.
Show the answer
B − D is 100, 150, 225, 338 and 506 in weeks 1 to 5, but (B − D) ÷ N is 0.50 every week. A constant per capita rate times a growing N is exponential growth.
- The per capita growth rate rises each week, so the population grows faster and faster.: The per capita rate is 0.50 in every week; the total rate rises because N rises.
- The number added each week stays at about 100 beetles, as in linear growth.: 100 are added in week 1 but 506 in week 5.
- Correct: The number added each week rises while the per capita rate stays at 0.50: exponential growth.: Correct: constant per capita rate, rising dN/dt.
- Both the number added and the per capita rate fall as the container fills with beetles.: Food was replaced each week and both rates show no fall: the per capita rate stays at 0.50.
6. A student counts dandelions in ten 1 m² quadrats placed at random on a 400 m² lawn and finds 3, 5, 2, 4, 6, 3, 4, 2, 5 and 6 plants. Estimate the number of dandelions on the whole lawn. Give a whole number.
Type a number in dandelions.
Show the answer
Total = 40 plants in 10 m², so the mean density is 4.0 per m². 4.0 per m² × 400 m² = 1,600 dandelions.
- Answer: 1600 dandelions
7. Species X reaches adulthood in 3 weeks, lays about 500 eggs and gives no care. Species Y reaches adulthood in 4 years and raises one young every 2 years. A flood kills 95% of each population. Which prediction is best supported?
- Y will recover faster, because its well-cared-for young are more likely to survive the flood.
- X will recover much faster, because its high r_max lets a few survivors multiply quickly.
- Both will recover at the same speed, because both lost the same percentage of individuals.
- Neither will recover, because a loss of 95% leaves too few individuals to reproduce.
Show the answer
Recovery depends on how fast survivors can reproduce. X's early maturity and huge clutches give a very high r_max; Y adds few young each year and recovers over decades.
- Y will recover faster, because its well-cared-for young are more likely to survive the flood.: Better survival of young does not make up for producing one young every 2 years.
- Correct: X will recover much faster, because its high r_max lets a few survivors multiply quickly.: Correct: r-selected traits mean fast recovery after a disaster.
- Both will recover at the same speed, because both lost the same percentage of individuals.: Equal losses do not mean equal recovery; their growth rates differ enormously.
- Neither will recover, because a loss of 95% leaves too few individuals to reproduce.: Five percent of a population can still reproduce; X especially can rebuild quickly.
8. Two populations of the same insect have the same r_max and are growing exponentially. Population A has 10,000 individuals and population B has 100. Which statement is correct?
- B is growing faster, because a small population has more resources for each individual.
- Both add the same number of insects per day, because they have the same r_max.
- A adds 100 times as many insects per day, though both grow by the same fraction.
- A grows more slowly per individual, because a large population has a lower r_max.
Show the answer
dN/dt = r_max N. With the same r_max, dN/dt is proportional to N, so A, 100 times larger, adds 100 times as many per day. Per capita, both grow at r_max.
- B is growing faster, because a small population has more resources for each individual.: Both are growing exponentially at the same r_max, so resources are not limiting either one yet.
- Both add the same number of insects per day, because they have the same r_max.: The same r_max means the same per capita rate, not the same number added.
- Correct: A adds 100 times as many insects per day, though both grow by the same fraction.: Correct: same per capita rate, numbers added proportional to N.
- A grows more slowly per individual, because a large population has a lower r_max.: r_max is a property of the species under ideal conditions; both share it.
Part 9 · Summary
Summary
A population is described by its density (individuals per unit area) and its dispersion (clumped, uniform or random). Demography follows births, deaths and migration: with no migration, dN/dt = B − D, and dividing by N gives the per capita growth rate. Under ideal conditions the per capita rate reaches r_max, the intrinsic rate of increase, and the population grows exponentially, dN/dt = r_max N: a constant fraction is added each period, so the number added keeps rising and the curve is J-shaped. Life history traits set r_max. r-selected species mature early and produce many small offspring with little care, so they grow and recover fast; K-selected species mature late and raise few offspring with much care. Semelparous species reproduce once; iteroparous species reproduce repeatedly. Survivorship curves show how survival changes with age: Type I species lose few until old age, Type II lose a constant fraction at every age, and Type III lose most of their young.
Part 10 · Up next
What comes next
Part 11 · Connections