Effect of Density of Populations
No population grows exponentially for long.
Part 1 · Hook
Why this matters
In 1944, 29 reindeer were released on St. Matthew Island in the Bering Sea, an island thick with lichen and with no wolves. By 1963 there were about 6,000. Three years later there were fewer than 50. The reindeer had eaten the slow-growing lichen faster than it could regrow, and a hard winter did the rest. No population can keep growing exponentially: sooner or later, crowding catches up with it.
Part 2 · Before you start
What this builds on
Part 3 · Prerequisite check
Quick check before you start
1. In exponential growth (dN/dt = r_max N), what happens to dN/dt when N doubles?
- It doubles
- It stays the same
- It halves
Show the answer
dN/dt is proportional to N when r_max is constant, so twice as many individuals add twice as many per unit time.
- Correct: It doubles:
- It stays the same:
- It halves:
2. A limiting factor is
- the factor in shortest supply, which sets the rate of a process
- any factor that speeds up a process
- the factor present in the largest amount
Show the answer
Adding more of anything else does not help until the limiting factor is raised.
- Correct: the factor in shortest supply, which sets the rate of a process:
- any factor that speeds up a process:
- the factor present in the largest amount:
3. Individuals compete when they
- need the same resource and there is not enough for all of them
- live in the same area at different times of year
- share genes from a common ancestor
Show the answer
Competition happens when a needed resource is limited, so one individual's use leaves less for others.
- Correct: need the same resource and there is not enough for all of them:
- live in the same area at different times of year:
- share genes from a common ancestor:
Part 4 · See it
See it first
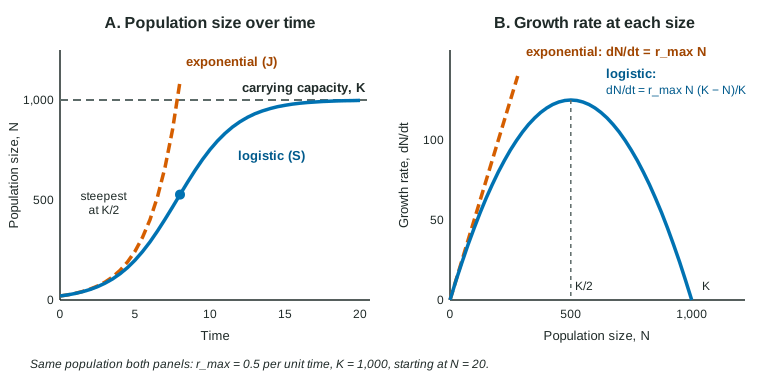
Part 5 · Step by step
How it works, step by step
- A few individuals arrive where food, water and space are plentiful.The per capita growth rate is close to r_max, and the population grows almost exponentially.
- As N rises, each individual gets a smaller share of the limiting resources.Intraspecific competition increases: individuals that lose get less food, find no nest site or grow less.
- Hungrier, more crowded individuals have fewer offspring, die more often, catch diseases from each other more easily and are caught by predators more often.The per capita birth rate falls and the per capita death rate rises: these factors are density-dependent.
- The per capita growth rate shrinks toward zero as N approaches the carrying capacity K.dN/dt = r_max N (K − N)/K: growth is fastest at K/2 and stops at K, giving an S-shaped curve.
- If N rises above K, deaths exceed births.N falls back toward K, or crashes if the overcrowded population damaged its food supply and lowered K.
- A frost, fire, flood or drought strikes.It kills about the same fraction whatever the density (density-independent), so N drops suddenly, then regrows toward K.
Part 6 · Key ideas
Key ideas
- A limiting resource (food, water, space, light, nutrients) caps growth. The largest population an environment can support over time is its carrying capacity, K.
- Logistic growth: dN/dt = r_max N (K − N)/K. The (K − N)/K factor is the fraction of K still unused: near 1 when N is small, 0 at K, negative above K.
- Growth is fastest at N = K/2; the curve is S-shaped.
- Density-dependent factors (competition, disease, wastes, predators) act harder as density rises and hold N near K. Density-independent factors (weather, fire, floods) kill a similar fraction at any density.
- Intraspecific competition is competition within a species. Linked prey and predator populations can rise and fall in population cycles, with the predator's peaks lagging the prey's.
Part 7 · Misconception
A common mistake
The wrong idea: A population grows fastest when it is close to its carrying capacity, because that is when there are the most individuals.
What actually happens: Growth is fastest at about half of K. Near K there are many individuals, but each has so few resources that births barely exceed deaths, so (K − N)/K is close to zero.
Part 8 · Check yourself
Check yourself
Exam-style questions. Anything you miss goes into your review queue.
Graph
Hares and lynx over 20 years
Trappers' records and field counts were used to estimate the numbers of snowshoe hares and of lynx, a cat that eats mainly hares, in one region of northern Canada over 20 years. Hares are plotted in hundreds per 100 km² and lynx in individuals per 100 km², so both fit on one axis.
Hares (hundreds per 100 km²)Lynx (individuals per 100 km²)
Data table
| Year | Hares (hundreds per 100 km²) | Lynx (individuals per 100 km²) |
|---|---|---|
| 0 | 5 | 2 |
| 1 | 12 | 2 |
| 2 | 28 | 4 |
| 3 | 52 | 8 |
| 4 | 60 | 15 |
| 5 | 35 | 22 |
| 6 | 12 | 20 |
| 7 | 5 | 12 |
| 8 | 3 | 6 |
| 9 | 4 | 3 |
| 10 | 8 | 2 |
| 11 | 18 | 3 |
| 12 | 40 | 6 |
| 13 | 58 | 12 |
| 14 | 55 | 20 |
| 15 | 28 | 24 |
| 16 | 10 | 16 |
| 17 | 4 | 8 |
| 18 | 3 | 4 |
| 19 | 5 | 2 |
| 20 | 10 | 2 |
1. Which statement best describes the data?
- Both populations rise and fall in cycles of about 9 to 10 years, and the lynx peaks come 1 to 2 years after the hare peaks.
- Both populations rise and fall in cycles of about 9 to 10 years, and the hare peaks come 1 to 2 years after the lynx peaks.
- The hare population cycles over about 9 to 10 years, but the lynx population stays nearly constant throughout.
- Both populations peak in the same years, so the two cycles move up and down together with no delay between them.
Show the answer
Hares peak in years 4 and 13; lynx peak in years 5 and 15. Both cycle with a period of about 9-10 years, and the lynx lag the hares.
- Correct: Both populations rise and fall in cycles of about 9 to 10 years, and the lynx peaks come 1 to 2 years after the hare peaks.: Correct: same period, lynx lagging hares.
- Both populations rise and fall in cycles of about 9 to 10 years, and the hare peaks come 1 to 2 years after the lynx peaks.: This reverses the order: each lynx peak follows a hare peak.
- The hare population cycles over about 9 to 10 years, but the lynx population stays nearly constant throughout.: Lynx range from 2 to 24 per 100 km², a twelve-fold change.
- Both populations peak in the same years, so the two cycles move up and down together with no delay between them.: The peaks are offset: hares in year 4, lynx in year 5; hares in year 13, lynx in year 15.
2. Which explanation best accounts for the lynx peaks coming after the hare peaks?
- Lynx numbers rise only after hares become plentiful, because well-fed lynx raise more kits, and kits take time to be born and grow.
- Lynx numbers rise first and frighten the hares into breeding faster, which then brings the hare peak one or two years later.
- Lynx and hares both respond to the same weather, but lynx take longer to notice the change, so their numbers rise later.
- Lynx eat the hares' food plants, so lynx numbers rise after the hares have finished eating the plants back.
Show the answer
Lynx depend on hares for food. When hares are abundant, more lynx survive and breed, but adding new lynx takes a breeding season or two, so lynx numbers peak after hares. Then many lynx and scarce winter food drive hares down, and lynx follow.
- Correct: Lynx numbers rise only after hares become plentiful, because well-fed lynx raise more kits, and kits take time to be born and grow.: Correct: the predator responds to its food with a breeding delay.
- Lynx numbers rise first and frighten the hares into breeding faster, which then brings the hare peak one or two years later.: The graph shows lynx peaks after hare peaks, not before.
- Lynx and hares both respond to the same weather, but lynx take longer to notice the change, so their numbers rise later.: Nothing in the data points to weather, and the lynx depend on hares, which explains the lag directly.
- Lynx eat the hares' food plants, so lynx numbers rise after the hares have finished eating the plants back.: Lynx are meat-eaters; they eat hares, not the hares' plants.
Graph
Paramecium cultures with two amounts of food
A student started eight cultures of the single-celled Paramecium, each with 5 cells per mL in 50 mL of medium at 22 °C. Four cultures got the standard amount of food (bacteria added daily); four got twice as much. Every 2 days the student counted cells in samples. Points are means of four cultures; error bars show ± 2 SE.
Standard foodDouble food
Data table
| Time (days) | Standard food (± error) | Double food (± error) |
|---|---|---|
| 0 | 5 ± 1 | 5 ± 1 |
| 2 | 22 ± 4 | 25 ± 4 |
| 4 | 101 ± 12 | 108 ± 14 |
| 6 | 270 ± 25 | 384 ± 30 |
| 8 | 434 ± 30 | 745 ± 40 |
| 10 | 480 ± 28 | 930 ± 45 |
| 12 | 503 ± 26 | 982 ± 38 |
| 14 | 494 ± 24 | 1003 ± 40 |
| 16 | 498 ± 25 | 991 ± 42 |
3. What is the best estimate of the carrying capacity of the standard-food cultures, and the evidence for it?
- About 270 cells per mL, the density reached on day 6, when growth was fastest
- About 1,000 cells per mL, the density the double-food cultures reached by day 14
- About 500 cells per mL, where the density levels off from day 10 to day 16
- About 250 cells per mL, half of the highest density reached by the cultures
Show the answer
From day 10 the standard cultures stay between 480 and 503 cells per mL, overlapping error bars: growth has stopped, so K ≈ 500 cells per mL.
- About 270 cells per mL, the density reached on day 6, when growth was fastest: Growth was fast around day 6, which is near K/2, not K.
- About 1,000 cells per mL, the density the double-food cultures reached by day 14: That is the double-food cultures' level, a different environment with a different K.
- Correct: About 500 cells per mL, where the density levels off from day 10 to day 16: Correct: the plateau gives K.
- About 250 cells per mL, half of the highest density reached by the cultures: Half the plateau is K/2, where growth is fastest; K is the plateau itself.
4. For the standard-food cultures, r_max = 0.8 per day and K = 500 cells per mL. Use dN/dt = r_max N (K − N)/K to calculate the growth rate when N = 250 cells per mL, in cells per mL per day. Give a whole number.
Type a number in cells per mL per day.
Show the answer
dN/dt = 0.8 × 250 × (500 − 250)/500 = 0.8 × 250 × 0.5 = 100 cells per mL per day. N = 250 is K/2, where logistic growth is fastest.
- Answer: 100 cells per mL per day
5. Which conclusion about the double-food cultures is best supported by the data?
- Doubling the food doubled r_max, so the cultures grew twice as fast from day 0 and leveled off at the same density.
- Doubling the food made no difference, because the error bars overlap at each point on the graph.
- Doubling the food removed the carrying capacity, so these cultures kept growing exponentially to day 16.
- Doubling the food raised the carrying capacity to about 1,000 cells per mL, while early growth was about the same.
Show the answer
Food is the limiting resource: twice the food supports about twice as many cells (plateau about 980-1,000 cells per mL). The first days are nearly identical (22 vs 25 on day 2, 101 vs 108 on day 4), so r_max did not change.
- Doubling the food doubled r_max, so the cultures grew twice as fast from day 0 and leveled off at the same density.: Early densities are almost the same, so r_max is about the same; the two plateaus differ.
- Doubling the food made no difference, because the error bars overlap at each point on the graph.: From day 6 the error bars are far apart (for example 434 ± 30 vs 745 ± 40 on day 8).
- Doubling the food removed the carrying capacity, so these cultures kept growing exponentially to day 16.: The double-food cultures level off from day 12 (982, 1,003, 991).
- Correct: Doubling the food raised the carrying capacity to about 1,000 cells per mL, while early growth was about the same.: Correct: more of the limiting resource means a higher K.
6. Select the two factors that are density-dependent.
- A virus that spreads faster when caterpillars are packed closely on leaves
- A hard frost that kills 30% of the caterpillars on a tree
- Competition among songbirds for a limited number of nest holes
- A forest fire that burns 60% of a lizard population's habitat
- A hurricane that floods a marsh and drowns many of its voles
Show the answer
Disease spread and competition for nest holes both act more strongly, on a larger fraction, as the population becomes denser.
- Correct: A virus that spreads faster when caterpillars are packed closely on leaves: Density-dependent: crowding speeds transmission.
- A hard frost that kills 30% of the caterpillars on a tree: Density-independent: the frost kills a similar fraction at any density.
- Correct: Competition among songbirds for a limited number of nest holes: Density-dependent: more birds per hole means a larger share go without.
- A forest fire that burns 60% of a lizard population's habitat: Density-independent: fire burns habitat whatever the density.
- A hurricane that floods a marsh and drowns many of its voles: Density-independent: flooding kills regardless of crowding.
7. A deer herd of 800 lives in a reserve with a carrying capacity of 1,000. A summer drought kills 40% of the deer, and the plants recover fully the next spring. Predict each quantity the next spring, compared with before the drought.
| Variable | Change |
|---|---|
| Number of deer | — |
| Food available per deer | — |
| Population growth rate, dN/dt | — |
| Carrying capacity of the reserve | — |
Show the answer
A density-independent loss pushes the herd further below K, where each deer has more food, so the herd grows faster back toward an unchanged K.
- Number of deer: decreases. 40% of 800 died, leaving 480.
- Food available per deer: increases. The same plant supply is shared by fewer deer.
- Population growth rate, dN/dt: increases. At 480 deer, (K − N)/K = 0.52 instead of 0.2: with r_max = 0.4, dN/dt rises from 64 to about 100 deer per year.
- Carrying capacity of the reserve: no change. The plants recovered fully, so the reserve can still support about 1,000 deer.
8. After a very wet year, the same rabbit population (r_max = 0.4 per year) has grown to 1,200, but the habitat can still support only 1,000. Use dN/dt = r_max N (K − N)/K to calculate the growth rate, in rabbits per year. Include the sign and give a whole number.
Type a number in rabbits per year.
Show the answer
dN/dt = 0.4 × 1,200 × (1,000 − 1,200)/1,000 = 0.4 × 1,200 × (−0.2) = −96 rabbits per year. Above K the factor (K − N)/K is negative, so the population shrinks.
- Answer: -96 rabbits per year
Part 9 · Summary
Summary
No population grows exponentially for long. Limiting resources such as food, water, light and space set a carrying capacity, K: the largest population the environment can support over time. As N rises, intraspecific competition for those resources grows, so per capita births fall and deaths rise. Logistic growth captures this: dN/dt = r_max N (K − N)/K. The curve is S-shaped, growth is fastest at K/2, and it stops at K; a population above K shrinks. Density-dependent factors (competition, disease, wastes, predators) act harder in crowded populations and keep numbers near K. Density-independent factors such as frost, fire, floods and drought kill a similar fraction at any density and cause sudden drops. Linked prey and predator populations can rise and fall in regular population cycles, with the predator's peaks following the prey's.
Part 10 · Up next
What comes next
Part 11 · Connections