Independent and dependent variables
A controlled experiment changes one factor, the independent variable, and measures one response, the dependent variable.
Part 1 · Hook
Why this matters
Leave a glass of water on a sunny windowsill and another in a cool cupboard. A week later the windowsill glass is lower. Was it the warmth? The light? The draft from the window? Unless you change one thing at a time, you cannot tell, and every lab question on the exam starts by asking which thing you changed.
Part 2 · Before you start
What this builds on
Part 3 · Prerequisite check
Quick check before you start
1. To escape from liquid water as vapor, what must a water molecule do?
- Break the hydrogen bonds holding it to its neighbors
- Break the covalent bonds inside the molecule
- Gain extra hydrogen atoms from the air
Show the answer
Evaporation means pulling free of neighboring molecules, which are held by hydrogen bonds. The covalent bonds inside the molecule stay intact.
- Correct: Break the hydrogen bonds holding it to its neighbors:
- Break the covalent bonds inside the molecule:
- Gain extra hydrogen atoms from the air:
2. A student measures 30, 32, 31 and 45 drops. Which summary is least affected by the 45?
- The median
- The mean
- The range
Show the answer
The median depends only on the middle of the sorted values, so one extreme value barely moves it.
- Correct: The median:
- The mean:
- The range:
Part 4 · See it
See it first
Part 5 · Step by step
How it works, step by step
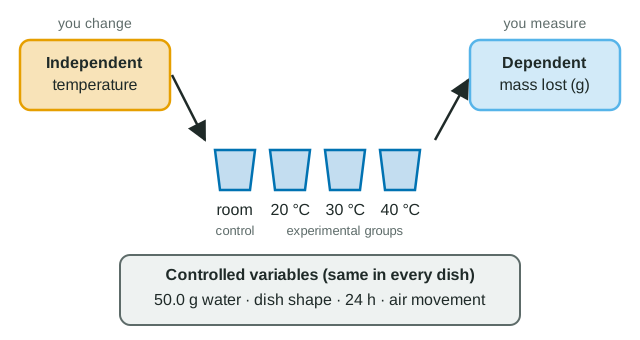
- You ask a testable question: does temperature affect how much water evaporates in 24 hours?The question names the factor you will change (temperature) and the result you will measure (mass lost).
- You set dishes to 20, 30 and 40 °C.Temperature is the independent variable: you choose its values.
- You weigh each dish before and after 24 hours.Mass lost is the dependent variable: it may respond to temperature.
- You keep dish shape, starting mass, time and air movement identical in every group.These controlled variables cannot explain a difference, so a change in mass lost can be traced to temperature.
- You run three dishes per temperature and add an unheated group for comparison.Repeats show chance variation, and the control group shows the baseline, so you can judge whether temperature really made a difference.
Part 6 · Key ideas
Key ideas
- Worked example. "Dishes of 50.0 g water at 20, 30 and 40 °C; mass lost in 24 h measured." Independent variable: temperature (set). Dependent variable: mass lost (measured). Controlled: dish, starting mass, time, air movement. Control group: unheated dishes. If-then: if temperature rises, then more water evaporates, because more molecules escape their hydrogen bonds.
- Quick test: the independent variable is what you set before the run; the dependent variable is what you read off at the end.
- A control group is a whole group given the baseline; a controlled variable is one factor held the same in every group. Exams mark answers down for mixing them up.
- If two factors change together (temperature and a fan), the result cannot be traced to either one. Look for that flaw in every described experiment.
Part 7 · Misconception
A common mistake
The wrong idea: The control group is the group where everything is controlled.
What actually happens: Every group in a good experiment has the same controlled variables. The control group is the one given the baseline condition (no treatment, or the normal value), used for comparison.
Part 8 · Check yourself
Check yourself
Exam-style questions. Anything you miss goes into your review queue.
Experimental setup
How far does water climb a paper strip?
A student cut strips of the same filter paper, all 15 cm long, in four widths. She hung each strip so its bottom 1 cm dipped into a beaker of water at room temperature, and after 10 minutes measured how high the wet front had climbed. She tested three strips of each width.
| Strip width (cm) | Strip 1 (cm) | Strip 2 (cm) | Strip 3 (cm) | Mean (cm) |
|---|---|---|---|---|
| 0.5 | 6.1 | 6.4 | 5.9 | 6.1 |
| 1.0 | 6.2 | 6.0 | 6.3 | 6.2 |
| 2.0 | 6.1 | 6.2 | 5.8 | 6.0 |
| 4.0 | 6.0 | 6.3 | 6.1 | 6.1 |
1. In this investigation, what are the independent and dependent variables?
- Independent: width of the strip. Dependent: height the water climbed in 10 minutes.
- Independent: height the water climbed. Dependent: width of the strip the student cut.
- Independent: the type of filter paper. Dependent: the time the strips were left in water.
- Independent: the 10-minute time limit. Dependent: the width and the height of each wet strip.
Show the answer
The student chose four widths (the factor she changed) and measured the height of the wet front (the response).
- Correct: Independent: width of the strip. Dependent: height the water climbed in 10 minutes.: Correct: she set the width and measured the height.
- Independent: height the water climbed. Dependent: width of the strip the student cut.: This reverses them; the height is what she measured, not what she set.
- Independent: the type of filter paper. Dependent: the time the strips were left in water.: Paper type and time were kept the same for every strip; they are controlled variables.
- Independent: the 10-minute time limit. Dependent: the width and the height of each wet strip.: The time was fixed for all strips, and the width was chosen, not measured.
2. Select ALL of the factors that were controlled variables in this investigation.
- Type of paper
- Width of the strip
- Time before measuring
- Height of the wet front
- Mean height for each width
Show the answer
Controlled variables are kept the same for every strip: the same filter paper, the same 10 minutes and the same 1 cm dipped in.
- Correct: Type of paper: Controlled: every strip was cut from the same filter paper.
- Width of the strip: Not controlled: width is the independent variable, the factor deliberately changed.
- Correct: Time before measuring: Controlled: every strip was measured after 10 minutes.
- Height of the wet front: Not controlled: height is the dependent variable, the measured result.
- Mean height for each width: Not controlled: the mean height is calculated from the dependent variable after the run.
3. Which conclusion do these data support?
- Over this range, strip width had no clear effect on how high water climbed in 10 minutes.
- Wider strips pulled water higher, because a wider strip has more paper for water to stick to.
- Narrower strips pulled water higher, because their mean height at 0.5 cm was the largest value.
- The investigation failed, because a well-designed experiment shows a difference between groups.
Show the answer
The means (6.1, 6.2, 6.0, 6.1 cm) differ by less than the spread within each width (strips of the same width differ by up to 0.5 cm). There is no trend with width.
- Correct: Over this range, strip width had no clear effect on how high water climbed in 10 minutes.: Correct: the differences between means are smaller than the differences among repeats of the same width.
- Wider strips pulled water higher, because a wider strip has more paper for water to stick to.: The means do not rise with width: 4.0 cm strips averaged the same as 0.5 cm strips.
- Narrower strips pulled water higher, because their mean height at 0.5 cm was the largest value.: The 0.5 cm mean (6.1 cm) is not the largest, and a 0.1 cm difference is far smaller than the variation among repeats.
- The investigation failed, because a well-designed experiment shows a difference between groups.: A result showing no effect is a real finding when the design is sound; experiments test, they do not have to show a change.
Data table
Evaporation at three temperatures
A class put 50.0 g of water into identical open dishes and left them for 24 hours in warming cabinets set to 20, 30 or 40 °C, three dishes per temperature. They weighed each dish at the start and end. The 40 °C cabinet was the only one with a small fan inside to keep its temperature even.
| Cabinet temperature (°C) | Dish 1 (g) | Dish 2 (g) | Dish 3 (g) | Mean (g) |
|---|---|---|---|---|
| 20 | 2.1 | 2.4 | 2.2 | 2.2 |
| 30 | 4.0 | 4.3 | 3.8 | 4.0 |
| 40 | 7.2 | 6.9 | 7.5 | 7.2 |
4. Which feature of the procedure most weakens the conclusion that temperature alone caused the 40 °C dishes to lose the most water?
- Only the 40 °C cabinet had a fan, so moving air was a second difference between the groups.
- Three dishes per temperature is too few repeats for any comparison of the means to be made.
- The dishes were weighed at the start, which could have disturbed the water before the experiment.
- Mass of water lost is a dependent variable, so it is not possible to control it during the experiment.
Show the answer
Moving air carries water vapor away from the surface and speeds evaporation. Because the fan was only in the 40 °C cabinet, the 40 °C group differed in two ways, so the extra loss cannot be credited to temperature alone. Air movement should have been a controlled variable.
- Correct: Only the 40 °C cabinet had a fan, so moving air was a second difference between the groups.: Correct: two factors changed together, so their effects cannot be separated.
- Three dishes per temperature is too few repeats for any comparison of the means to be made.: Three repeats is few, but the 40 °C dishes (6.9-7.5 g) do not overlap the others; the bigger problem is the second difference.
- The dishes were weighed at the start, which could have disturbed the water before the experiment.: Every dish was weighed the same way, so weighing is the same in every group and cannot explain a difference.
- Mass of water lost is a dependent variable, so it is not possible to control it during the experiment.: The dependent variable is measured, not controlled, but that is how every experiment works, not a weakness.
5. Which is the best if-then prediction for this experiment?
- If the water temperature is higher, then more water will evaporate in 24 hours, because more molecules have enough energy to break their hydrogen bonds and escape.
- If water evaporates, then the temperature of the cabinet will rise, because evaporation releases heat into the surrounding air and warms the inside of each cabinet.
- If the dishes are identical, then the experiment will be fair, because identical dishes hold the same mass of water.
- If more water is lost, then the temperature was higher, because hot water evaporates.
Show the answer
An if-then prediction starts with the independent variable (temperature), states the expected change in the dependent variable (mass lost) and gives a reason (more molecules can break free of their hydrogen bonds).
- Correct: If the water temperature is higher, then more water will evaporate in 24 hours, because more molecules have enough energy to break their hydrogen bonds and escape.: Correct: IV in the "if", DV in the "then", reason after "because".
- If water evaporates, then the temperature of the cabinet will rise, because evaporation releases heat into the surrounding air and warms the inside of each cabinet.: This reverses the variables, and evaporation removes heat from what is left behind rather than releasing it.
- If the dishes are identical, then the experiment will be fair, because identical dishes hold the same mass of water.: This describes a controlled variable, not a prediction about the dependent variable.
- If more water is lost, then the temperature was higher, because hot water evaporates.: This runs backward, from result to cause, and the reason simply repeats the claim.
6. The class wants a group that shows how much water an open dish loses with no warming at all. Which addition is the best control group?
- Three identical dishes of 50.0 g water left at room temperature in a cabinet that is switched off, with no fan
- Three dishes of 50.0 g water at 50 °C, to extend the range of temperatures that were tested
- One dish of 50.0 g water sealed with a lid in the 40 °C cabinet, to show what happens when no water can escape the dish
- Three dishes holding 100.0 g of water at 20 °C, so that more water is available to evaporate
Show the answer
A control group gets the baseline condition (no warming) while everything else matches the experimental groups: same dishes, same mass, same cabinet type and the same time.
- Correct: Three identical dishes of 50.0 g water left at room temperature in a cabinet that is switched off, with no fan: Correct: baseline temperature, everything else identical, with repeats.
- Three dishes of 50.0 g water at 50 °C, to extend the range of temperatures that were tested: A 50 °C group is another experimental group, not a no-warming baseline.
- One dish of 50.0 g water sealed with a lid in the 40 °C cabinet, to show what happens when no water can escape the dish: A sealed dish changes a different factor (open versus closed) and is a single dish, so it is not the baseline for open dishes.
- Three dishes holding 100.0 g of water at 20 °C, so that more water is available to evaporate: Changing the mass of water adds a second difference instead of providing a baseline.
7. To test whether salt affects how fast water cools, a student puts plain water in a glass beaker and salt water in a plastic cup, heats both and times the cooling. What is the main problem with this design?
- The container differs as well as the salt, so a difference in cooling time could come from either one.
- The student should measure temperature instead of time, because time is not a dependent variable.
- Salt water and plain water are different liquids, so comparing the two in one experiment is not a fair test.
- There is no hypothesis, and an experiment run without a written hypothesis produces no usable data.
Show the answer
Glass and plastic conduct heat differently. With two factors changed, any difference cannot be traced to salt. The container must be a controlled variable.
- Correct: The container differs as well as the salt, so a difference in cooling time could come from either one.: Correct: only the salt should differ.
- The student should measure temperature instead of time, because time is not a dependent variable.: Time to cool is a perfectly good dependent variable.
- Salt water and plain water are different liquids, so comparing the two in one experiment is not a fair test.: Comparing them is the point: salt is the independent variable.
- There is no hypothesis, and an experiment run without a written hypothesis produces no usable data.: A hypothesis helps planning, but data from a sound design are usable either way; the real flaw is the second variable.
Part 9 · Summary
Summary
A controlled experiment changes one factor, the independent variable, and measures one response, the dependent variable. Everything else is held constant as controlled variables, a control group shows the baseline, and repeated runs show chance variation. A testable question names both variables, and an if-then prediction links them with a reason.
Part 10 · Up next
What comes next
Part 11 · Connections