Blood pressure, flow and resistance are three sides of one relationship. Your heart creates pressure, your vessels resist flow, and the difference in pressure from one end of a vessel to the other pushes blood through it. This page explains each piece with worked numbers: what the two numbers in a blood pressure reading mean, how to calculate pulse pressure and mean arterial pressure, what sets the resistance of your vessels, why pressure falls where it does along the circulation, why blood slows down in the capillaries, and how a blood pressure cuff actually measures all this.
What a blood pressure reading means
A nurse wraps a cuff around your arm and says "118 over 76". Both numbers are pressures in your large arteries, in millimeters of mercury (mm Hg): 118 mm Hg is the pressure that would push a column of mercury 118 mm high. You met pressure, and this unit, in the topic on gradients.
The pressure in your arteries is not steady. It rises and falls with every heartbeat:
- Systolic pressure is the peak, reached while the left ventricle is ejecting blood during systole. In a healthy young adult at rest it is usually under 120 mm Hg.
- Diastolic pressure is the lowest point, reached just before the next ejection, at the end of diastole. It is usually under 80 mm Hg.
Together they are your arterial blood pressure, written systolic over diastolic: 118/76.
Why diastolic pressure is not zero
During diastole the ventricle is relaxed and the aortic valve is shut, so no blood enters the aorta. Yet arterial pressure only drifts down to about 80. The reason is the elastic arteries. During ejection, the ventricle pushes in blood faster than it can drain away through the arterioles, so the aorta and its large branches stretch. During diastole, their walls recoil and keep squeezing that stored blood forward into the arterioles. Pressure falls slowly as the blood runs off, and the next beat arrives before it falls far.
Pulse pressure
Pulse pressure is the difference between the two numbers: systolic minus diastolic. It is the size of the pressure swing you feel as a pulse.
Worked example 1: pulse pressure
Problem. A patient's blood pressure is 120/80 mm Hg. What is the pulse pressure?
- Write the definition. Pulse pressure = systolic pressure − diastolic pressure.
- Substitute. Pulse pressure = 120 − 80.
- Calculate. 40 mm Hg.
Answer. 40 mm Hg.
Two things set the size of the swing:
- How much blood is ejected per beat. A larger stroke volume stretches the arteries further, so systolic pressure rises more and pulse pressure widens. A small stroke volume, as after heavy bleeding or when fluid squeezes the heart in cardiac tamponade, narrows it.
- How stretchy the arteries are. With age, elastic fibers in the aorta are replaced by stiffer collagen. A stiff aorta cannot stretch to absorb each ejection, so systolic pressure climbs higher; and with less stored stretch to recoil, diastolic pressure falls lower. Pulse pressure widens. That is why many older adults have readings such as 150/70.
Mean arterial pressure
Blood is pushed through your organs all through the cardiac cycle, not just at the peak. The pressure that matters for flow is the average pressure in your arteries over the whole cycle. This is the mean arterial pressure (MAP).
It is not simply halfway between the two numbers. At rest, each cardiac cycle spends more time in diastole than in systole. At 75 beats per minute, one cycle lasts 0.8 seconds, of which ventricular systole takes about 0.3 seconds and diastole about 0.5 seconds. So your arteries spend more of each cycle near the low number, and the average sits closer to diastolic pressure.
The usual estimate is: MAP ≈ diastolic pressure + one-third of the pulse pressure.
Worked example 2: mean arterial pressure
Problem. A patient's blood pressure is 120/80 mm Hg and her heart rate is 70 beats per minute. Estimate her mean arterial pressure.
- Find the pulse pressure. 120 − 80 = 40 mm Hg.
- Take one-third of it. 40 ÷ 3 = 13.3 mm Hg.
- Add it to the diastolic pressure. 80 + 13.3 = 93.3 mm Hg.
- Check that it is sensible. 93 lies between 80 and 120, and closer to 80, as it should at a resting heart rate.
Answer. About 93 mm Hg.
Why the one-third rule works at rest
Picture the pressure in each resting cycle as two blocks of time: pressure near the systolic value for about one-third of the cycle, and near the diastolic value for about two-thirds. The average of the whole cycle is then a weighted average, each pressure counted for the share of time it lasts:
Worked example 3: where the formula comes from
Problem. Show that a time-weighted average of 120 and 80, with 120 lasting one-third of the cycle and 80 lasting two-thirds, gives the same answer as the one-third rule.
- Weight each pressure by its share of time. MAP ≈ (⅓ × 120) + (⅔ × 80).
- Calculate each term. ⅓ × 120 = 40. ⅔ × 80 = 53.3.
- Add. 40 + 53.3 = 93.3 mm Hg, the same as worked example 2.
- Rearrange in general. MAP ≈ ⅓ × systolic + ⅔ × diastolic. Split the ⅔ × diastolic into diastolic − ⅓ × diastolic: MAP ≈ diastolic + ⅓ × (systolic − diastolic), which is diastolic + ⅓ × pulse pressure.
Answer. Both give 93.3 mm Hg: the one-third rule is a time-weighted average in disguise.
The two blocks are a simplification. A real arterial pressure wave is a quick peak followed by a long, sloping fall, and the one-third weighting is a fit that happens to match that shape at resting heart rates. It breaks down in two ways:
- At fast heart rates, diastole shortens much more than systole. At 150 beats per minute, the cycle lasts 0.4 seconds and diastole takes only about half of it. The arteries now spend a larger share of each cycle near the peak, so the true mean is higher than the one-third rule predicts. Near half the pulse pressure above diastolic is a closer estimate at such rates.
- In individual people, measurements taken directly from inside an artery often put the mean a little higher than the rule, closer to 40% of the pulse pressure above diastolic.
Automated blood pressure machines do not use the formula at all: they measure the mean directly (see measuring blood pressure, below). A mean arterial pressure of about 65 mm Hg or more is needed to push enough blood through the brain, heart and kidneys; critically ill patients are treated to keep it there.
Blood flow and the flow equation
You learned the flow equation in the topic on gradients: F = ΔP / R. Flow equals the pressure difference between the two ends of a tube divided by the tube's resistance. It applies to one blood vessel, to one organ, and to the whole systemic circuit.
For blood flow through an organ, ΔP is the pressure in the artery feeding it minus the pressure in the vein draining it. Because venous pressure is low, ΔP is close to the mean arterial pressure.
Worked example 4: flow through one muscle
Problem. The artery feeding a resting thigh muscle has a mean pressure of 93 mm Hg. The vein draining it has a pressure of 3 mm Hg. The muscle's vascular bed has a resistance of 0.9 mm Hg for each mL/min of flow. What is the blood flow through the muscle?
- Find the pressure difference. ΔP = 93 − 3 = 90 mm Hg.
- Write the equation. F = ΔP / R.
- Substitute. F = 90 ÷ 0.9.
- Calculate. F = 100 mL/min. The mm Hg cancel, leaving mL/min.
Answer. 100 mL/min.
Worked example 5: the arterioles dilate
Problem. The muscle in worked example 4 starts to work. Smooth muscle in its arterioles relaxes, and their radius increases by 19%, to 1.19 times what it was. The pressures stay the same. What is the new flow?
- Recall the rule. Resistance depends on 1 ÷ radius4 (Poiseuille). Length and viscosity have not changed.
- Raise the change in radius to the fourth power. 1.19 × 1.19 = 1.42. 1.42 × 1.42 = 2.0. So radius4 has doubled.
- Find the new resistance. Resistance is divided by 2: 0.9 ÷ 2 = 0.45 mm Hg for each mL/min.
- Use the flow equation. F = 90 ÷ 0.45 = 200 mL/min.
Answer. 200 mL/min. A 19% wider radius doubled the flow, with no change in pressure.
This is how your body sends blood where it is needed. The pressure driving flow is roughly the same for every organ, because they all draw from the same arteries. Each organ sets its own share by adjusting the radius of its own arterioles.
What sets vascular resistance
Three factors set the resistance of a vessel, just as for any tube:
- Vessel length. Longer vessels have more resistance. In an adult, vessel length is essentially fixed, so it plays no part in moment-to-moment control.
- Blood viscosity. Thicker blood resists flow more. Viscosity depends mostly on the hematocrit. In polycythemia, a high hematocrit makes blood more viscous and raises resistance. In anemia, a low hematocrit lowers viscosity and resistance, which is one reason blood flow rises in anemia.
- Vessel radius. Resistance depends on 1 ÷ radius4, so small changes in radius cause large changes in resistance. Radius is the only one of the three that your body changes from second to second, by vasoconstriction and vasodilation of arterioles. That is why arterioles are called resistance vessels.
Total peripheral resistance
Total peripheral resistance (TPR), also called peripheral resistance, is the resistance of the whole systemic circulation, from the aorta to the venae cavae. Most of it sits in the arterioles. You can calculate it from the flow equation.
Worked example 6: total peripheral resistance
Problem. At rest, the whole systemic circuit carries 5 L of blood per minute. Mean arterial pressure is 93 mm Hg and the pressure in the right atrium, where the circuit ends, is 3 mm Hg. What is the total peripheral resistance?
- Find the pressure difference across the whole circuit. ΔP = 93 − 3 = 90 mm Hg.
- Rearrange the flow equation for resistance. F = ΔP / R, so R = ΔP / F.
- Substitute. R = 90 mm Hg ÷ 5 L/min.
- Calculate. R = 18 mm Hg for each L/min.
Answer. 18 mm Hg·min/L.
Organs are arranged in parallel
The systemic arteries split into separate routes, one through each organ, that rejoin in the veins. Routes arranged side by side like this are in parallel, and parallel routes add up to a lower total resistance than any one of them, because blood has many paths to choose from. Two consequences follow:
- When one organ's arterioles dilate, flow to that organ rises a lot, while total peripheral resistance falls only a little.
- Each organ gets blood at nearly full arterial pressure, not pressure left over from another organ. The exceptions are portal systems, such as the hepatic portal system, where two capillary beds are in series.
Pressure along the vascular tree
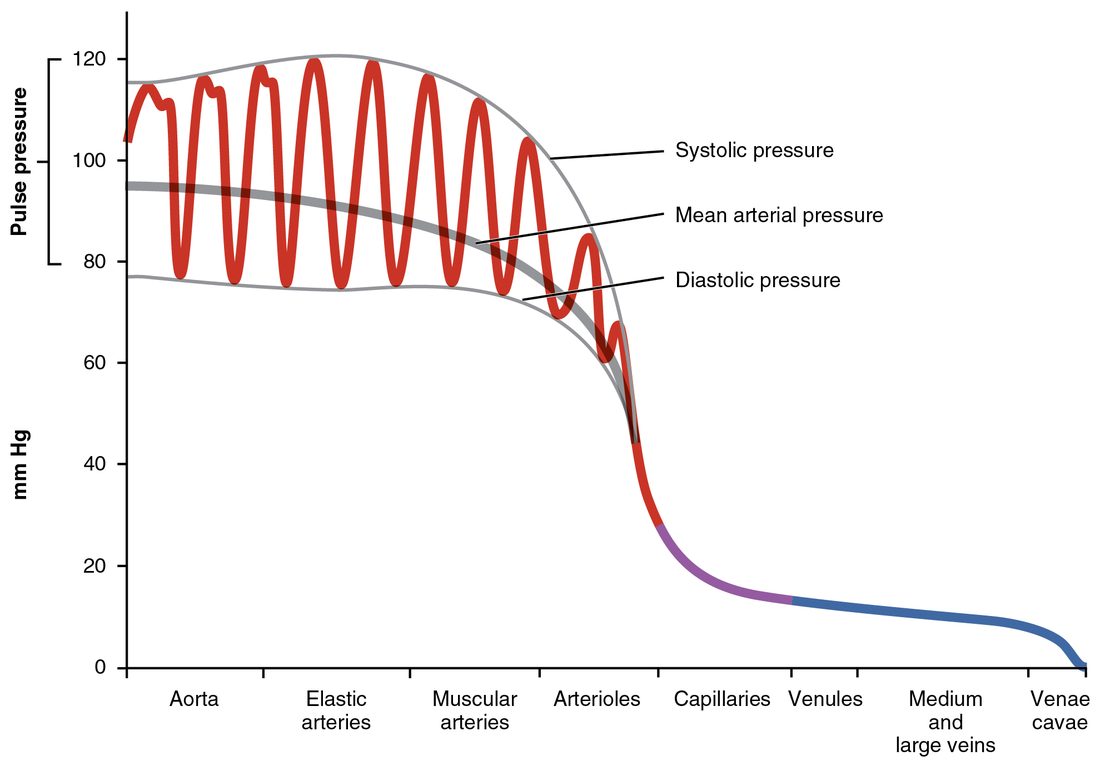
Follow the pressure of blood from the aorta to the right atrium (Figure 1).
- Aorta and large arteries. Pressure swings between about 120 and 80 with each beat. The mean falls only a few mm Hg along the large arteries, because they are wide and have little resistance.
- Arterioles. Pressure falls steeply, from around 85 to about 35 mm Hg. This is the biggest single drop in the circuit, because the arterioles hold the largest share of the resistance. By the rule F = ΔP / R, pushing the same flow through a large resistance uses up a large pressure difference. The pressure swings also die away here, so blood enters the capillaries at a steady pressure.
- Capillaries. Pressure falls from about 35 to about 15 mm Hg along their length.
- Venules and veins. Pressure falls slowly from about 15 mm Hg to near 0 at the right atrium. The veins are wide and have little resistance, so they need little pressure difference to carry the full flow.
That small remaining gradient, about 15 mm Hg from venules to the right atrium, drives blood back to the heart. When you lie still, it is enough on its own. When you stand, gravity opposes it in your legs, so venous return then gets important help from valves, the skeletal muscle pump and the respiratory pump. Figure 2 shows the same profile with the separate systolic, diastolic and mean lines drawn.
Flow velocity and cross-sectional area
Think of a river flowing into a wide lake. The same amount of water enters the lake each minute as flows in the river, but across the wide lake the water barely seems to move. Then it speeds up again where the lake narrows into an outlet.
Blood does the same. Two quantities are easy to confuse:
- Flow is volume per unit time, for example mL/min. In a closed circuit, the same total flow passes through every level of the tree each minute: all the arteries together, all the capillaries together, all the veins together.
- Velocity is how fast the blood moves, a distance per unit time, for example cm/s.
They are linked by cross-sectional area: the area of the opening that the blood flows through. Velocity = flow ÷ total cross-sectional area. When blood reaches a level of the tree with a larger total area, it slows down.
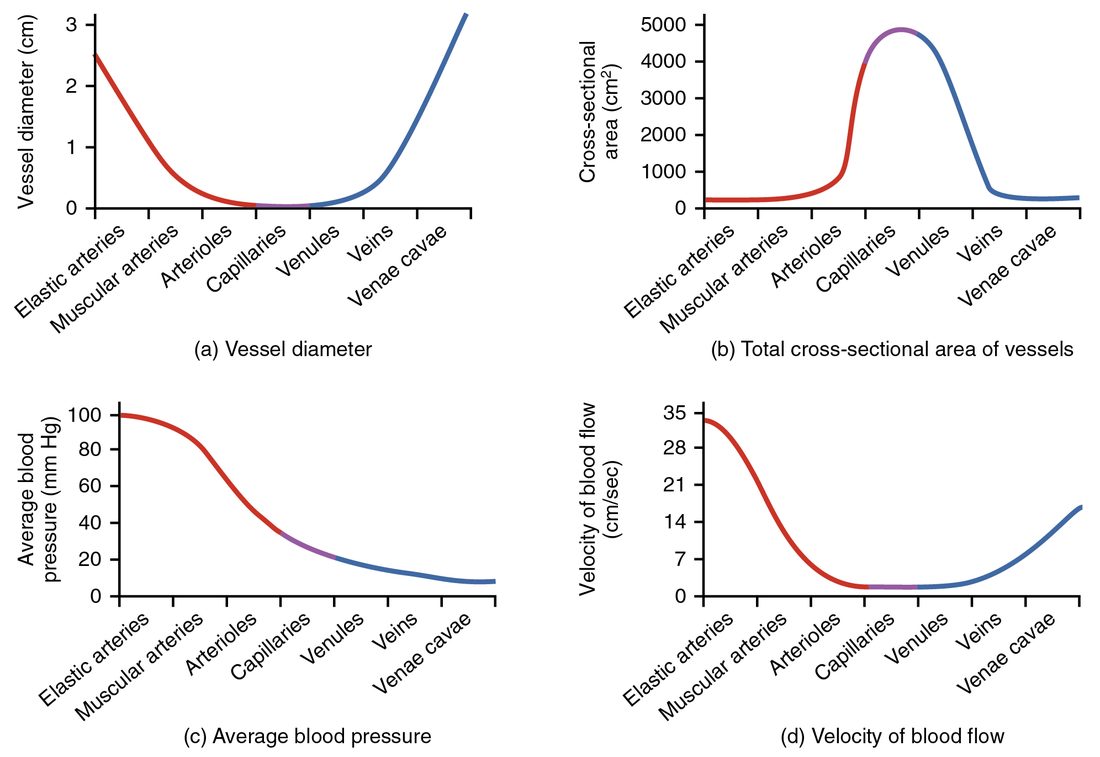
Each capillary is tiny, but you have billions of them side by side. Their total cross-sectional area is roughly a thousand times that of the aorta. So the blood slows about a thousandfold in the capillaries, then speeds up again as the veins merge into fewer, larger vessels (Figure 3).
Worked example 7: velocity in the aorta and in the capillaries
Problem. The systemic circuit carries 5 L/min. The aorta has a cross-sectional area of about 3 cm². All the systemic capillaries together have a cross-sectional area of about 3,000 cm². Find the average velocity of blood in each.
- Convert the flow into cm³ per second. 5 L = 5,000 mL = 5,000 cm³. 5,000 cm³ per minute ÷ 60 s = 83 cm³/s.
- Aorta. Velocity = flow ÷ area = 83 cm³/s ÷ 3 cm² = 28 cm/s. The cm³ ÷ cm² leaves cm.
- Capillaries. Velocity = 83 cm³/s ÷ 3,000 cm² = 0.028 cm/s, which is 0.28 mm/s.
- Compare. 28 ÷ 0.028 = 1,000. The area is 1,000 times larger, so the blood moves 1,000 times more slowly.
Answer. About 28 cm/s in the aorta and about 0.3 mm/s in the capillaries.
The slow passage through the capillaries matters. A red blood cell spends about a second crossing a capillary, long enough for oxygen, carbon dioxide, nutrients and wastes to move between the blood and the tissue. Figure 4 puts diameter, total area, pressure and velocity side by side; notice that estimates of total capillary area differ between sources, from about 2,500 to about 4,500 cm², because the number of capillaries open at any moment varies.
Measuring blood pressure
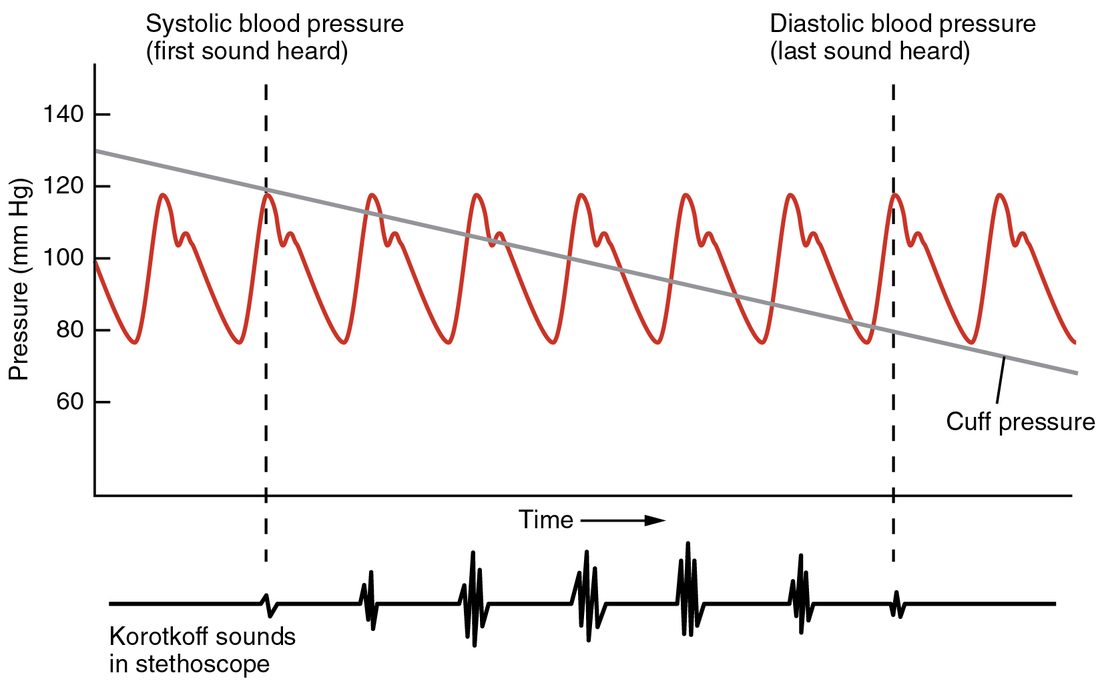
A sphygmomanometer (sphygmo- = pulse, mano- = thin, -meter = measure) is an inflatable cuff connected to a pressure gauge. With a stethoscope over the brachial artery, it measures arterial pressure in steps (Figure 5):
- Inflate the cuff above systolic pressure. The cuff squeezes the brachial artery shut at every point in the cycle. No blood passes, and you hear nothing below the cuff.
- Let the cuff pressure fall slowly, about 2 mm Hg per second.
- First tapping sound: systolic pressure. As soon as cuff pressure drops just below the peak of each wave, a spurt of blood forces through the squeezed artery at the peak of each beat. The jet of fast, swirling (turbulent) flow and the snap of the artery wall make tapping sounds, the Korotkoff sounds, named after the Russian surgeon Nikolai Korotkoff, who described them in 1905. The cuff pressure at the first sound is the systolic pressure.
- Sounds continue while cuff pressure lies between systolic and diastolic, because the artery opens at each peak and closes at each trough.
- Sounds disappear: diastolic pressure. Once cuff pressure falls below the trough of the wave, the artery stays open all the time, flow becomes smooth, and the sounds stop. The cuff pressure at the last sound is the diastolic pressure.
Getting an accurate reading
Most errors raise the reading. The main ones:
- Cuff too small. A narrow cuff needs extra pressure to squeeze the artery shut, so the reading comes out too high. The cuff's inflatable bladder should wrap at least 80% of the way around the arm.
- Arm below heart level. Blood in a vessel below the heart carries the added weight of the blood above it. The arm must be supported at heart level.
- Not rested. Talking, a full bladder, crossed legs, or no back support all raise the reading. The patient should sit quietly for about five minutes first.
Worked example 8: an arm hanging below the heart
Problem. A true reading at heart level is 120/80. The patient's arm hangs so that the cuff sits 13 cm below the heart. Each centimeter of blood adds about 0.77 mm Hg of pressure. What will the cuff read?
- Find the extra pressure from the column of blood. 13 cm × 0.77 mm Hg per cm = 10 mm Hg.
- Add it to both numbers. The extra weight acts all through the cycle. 120 + 10 = 130. 80 + 10 = 90.
Answer. About 130/90, 10 mm Hg too high for both numbers.
Other methods
- Automated cuffs do not listen for sounds. They sense the small pressure swings (oscillations) that the pulsing artery passes to the cuff. The swings are largest when cuff pressure equals mean arterial pressure, so the machine measures the mean directly and calculates the systolic and diastolic values from it.
- Palpation is used in noisy settings such as an ambulance. Feel the radial pulse, inflate the cuff until the pulse disappears, then deflate slowly. The pressure at which the pulse returns is the systolic pressure. Palpation cannot find the diastolic pressure.