Short-Run Aggregate Supply (SRAS)
SRAS shows the real output firms supply at each price level while wages and some prices are sticky, so it slopes up.
Part 1 · Hook
Why this matters
Part 2 · Before you start
What this builds on
Part 3 · Prerequisite check
Quick check before you start
1. What happens to the supply curve for bread when the price of flour rises?
- It shifts left
- It shifts right
- There is a movement up along it
- Nothing
Show the answer
An input price rise lowers supply at every price: the supply curve shifts left.
- Correct: It shifts left:
- It shifts right:
- There is a movement up along it:
- Nothing:
2. What is a real wage?
- The nominal wage adjusted for the price level
- The wage written in the contract
- The wage after taxes
- The minimum wage
Show the answer
A real wage is the nominal wage divided by a price index: what the wage can buy.
- Correct: The nominal wage adjusted for the price level:
- The wage written in the contract:
- The wage after taxes:
- The minimum wage:
Part 4 · See it
See it first
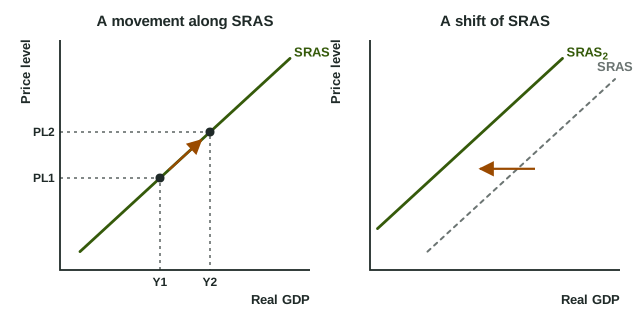
Part 5 · Step by step
How it works, step by step
- The price level rises while nominal wages are fixed by contractprofit on each extra unit rises
- Profit per unit risesfirms produce more real output: a movement up along SRAS
- Input prices (wages, oil) rise at a given price levelcosts per unit rise
- Costs per unit risefirms supply less at every price level: SRAS shifts left
Part 6 · Key ideas
Key ideas
- Short-run aggregate supply (SRAS) is the total real output firms supply at each price level in the short run, while nominal wages and some prices are fixed.
- SRAS slopes up because of sticky wages and prices: when the price level rises, many costs do not, so more output is profitable.
- A change in the price level moves along SRAS. A change in costs at a given price level shifts it.
- SRAS shifts left when input prices rise (nominal wages, energy, raw materials), productivity falls, business taxes or costly rules rise, or expected inflation rises (workers come to expect faster price growth and raise wage demands). The reverse shifts it right.
- A sudden, economy-wide change in input costs is a supply shock.
Part 7 · Misconception
A common mistake
The wrong idea: When workers get higher wages they spend more, so a rise in nominal wages shifts SRAS to the right.
What actually happens: For firms, wages are a cost. Higher nominal wages with the same productivity raise the cost of each unit, so SRAS shifts left.
Part 8 · Check yourself
Check yourself
Exam-style questions. Anything you miss goes into your review queue.
1. Why does the short-run aggregate supply curve slope upward?
- A higher price level makes households richer, so they buy more
- Sticky wages make extra output more profitable when the price level rises
- Workers demand higher wages whenever output rises
- A higher price level brings more workers into the country, so output rises
Show the answer
In the short run, wages set by contract and some sticky prices do not adjust at once, so a higher price level makes more output profitable.
- A higher price level makes households richer, so they buy more: That is about spending (AD), and a higher price level lowers real wealth rather than raising it.
- Correct: Sticky wages make extra output more profitable when the price level rises: Right: output prices rise while many costs stay fixed for a while, so firms produce more.
- Workers demand higher wages whenever output rises: If wages rose as fast as prices, profits would not rise and firms would not expand. It is wage stickiness that gives the slope.
- A higher price level brings more workers into the country, so output rises: The slope comes from fixed costs and contracts in the short run, not from migration.
2. The price level rises by 5 percent, but workers' wage contracts will not be renegotiated for a year. What happens in the short run?
- Firms produce less, because the price level is higher
- SRAS shifts right, because firms' profits rose
- Firms produce more, since prices rose but wage costs did not
- Nothing changes until the wage contracts are renegotiated next year
Show the answer
Sticky nominal wages mean a higher price level raises profit per unit, so firms move up along SRAS to more output.
- Firms produce less, because the price level is higher: A higher price level with sticky wages makes extra output more profitable, so output rises.
- SRAS shifts right, because firms' profits rose: The price level is on the axis; its change moves along SRAS rather than shifting it.
- Correct: Firms produce more, since prices rose but wage costs did not: Right: that is a movement up along SRAS.
- Nothing changes until the wage contracts are renegotiated next year: Firms respond at once to higher selling prices; only wages wait for the contracts.
3. Which change moves an economy along its SRAS curve instead of shifting it?
- A rise in the price level
- A rise in nominal wages
- A rise in productivity
- A fall in the price of oil
Show the answer
Only the variable on an axis moves the economy along the curve. Input prices, productivity and taxes on firms shift it.
- Correct: A rise in the price level: Right: the price level is on the vertical axis, so its change is a movement along SRAS.
- A rise in nominal wages: Wages are an input price; a change in them shifts SRAS.
- A rise in productivity: Productivity changes cost per unit and shifts SRAS.
- A fall in the price of oil: Oil is an input; a change in its price shifts SRAS.
Data
Costs and productivity in Country V
| Year | Average nominal wage (dollars per hour) | Oil (dollars per barrel) | Output per worker (units per hour) |
|---|---|---|---|
| 1 | 20 | 60 | 10 |
| 2 | 20 | 90 | 10 |
| 3 | 20 | 60 | 11 |
| 4 | 22 | 60 | 10 |
4. In Year 4 the nominal wage rose while output per worker was the same as in Year 1. What does this do to SRAS, and why?
- It shifts right, because workers with higher pay spend more
- It does not shift, because wages are not an input price
- It shifts left, because the labor cost of each unit of output rose
- It moves along SRAS to more output
Show the answer
Higher nominal wages with no gain in productivity raise firms' costs at every price level, so SRAS shifts left.
- It shifts right, because workers with higher pay spend more: Workers' spending is part of AD. For firms, wages are a cost, so SRAS shifts left.
- It does not shift, because wages are not an input price: Nominal wages are the price of labor, a key input. They shift SRAS.
- Correct: It shifts left, because the labor cost of each unit of output rose: Right: wages are the largest input cost; higher wages with the same productivity raise cost per unit.
- It moves along SRAS to more output: A change in an input price shifts SRAS; only a change in the price level moves along it.
5. Based on the table, what happened to SRAS in Year 3 compared with Year 1?
- It shifted left, because firms needed fewer workers
- It shifted right, as output per worker rose
- It did not change, because wages and oil prices were the same
- The economy moved up along SRAS to a higher price level
Show the answer
Output per worker rose from 10 to 11 with wages and oil unchanged: cost per unit fell, so SRAS shifted right.
- It shifted left, because firms needed fewer workers: Producing more per worker lowers cost per unit; that raises supply, it does not lower it.
- Correct: It shifted right, as output per worker rose: Right: higher productivity lowers the cost of each unit, so firms supply more at every price level.
- It did not change, because wages and oil prices were the same: Input prices did not change, but productivity rose, and productivity also shifts SRAS.
- The economy moved up along SRAS to a higher price level: Nothing in the table is the price level; a rise in productivity shifts the curve.
6. Which of the following would shift SRAS to the right? Select all that apply.
- A fall in the price of oil used by most firms
- A rise in consumer spending
- A rise in the price level
- A rise in nominal wages across the economy
Show the answer
SRAS shifts right when production costs per unit fall at a given price level, as with cheaper oil.
- Correct: A fall in the price of oil used by most firms: Right: cheaper inputs lower costs at every price level.
- A rise in consumer spending: Spending shifts AD, not SRAS.
- A rise in the price level: The price level is on the axis: its change moves along SRAS.
- A rise in nominal wages across the economy: Higher wages raise costs and shift SRAS left.
Part 9 · Summary
Summary
Part 10 · Up next
What comes next
Part 11 · Connections