Axes, Variables and Points
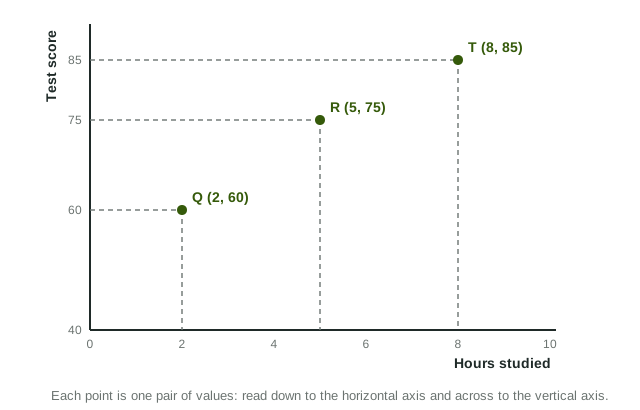
Every economics graph has two labeled axes, and every point on it is one ordered pair: the horizontal value first, then the vertical value.
Part 1 · Hook
Why this matters
Part 2 · See it
See it first
Part 3 · Step by step
How it works, step by step
- You label the horizontal axis and the vertical axisevery point on the graph stands for one pair of values
- A point is written as an ordered pair (horizontal, vertical)you can plot a row of a table or read one off the graph
- Several points rise together or move in opposite directionsthe graph shows a direct or an inverse relationship
- A reader sees every axis and curve labeledyour graph can earn its labeling point on the exam
Part 4 · Key ideas
Key ideas
- The horizontal axis runs across the bottom; the vertical axis runs up the side. A market graph puts Price on the vertical axis and Quantity on the horizontal one.
- A point is an ordered pair (horizontal value, vertical value): (300, 10) is 300 across and 10 up.
- In a direct relationship both variables rise together; in an inverse relationship one rises as the other falls.
- On the exam an unlabeled or swapped axis loses the graph point, even when the drawing is right.
Part 5 · Misconception
A common mistake
The wrong idea: If the picture is right, the labels do not matter.
What actually happens: Readers score labels first: every axis and every curve. A correct picture with a missing or swapped label still loses the labeling point.
Part 6 · Check yourself
Check yourself
Exam-style questions. Anything you miss goes into your review queue.
1. Label this graph of a market. Price goes up the side, quantity goes across the bottom, and each curve carries its name.
Work on the graph (it needs JavaScript), then check.
Show the answer
Price is on the vertical axis and Quantity on the horizontal axis; the falling curve is D (demand) and the rising one is S (supply). Readers check every label.
- Key: see the explanation
Data
Movie tickets at four prices
| Price per ticket ($) | Tickets sold per day |
|---|---|
| 6 | 500 |
| 8 | 400 |
| 10 | 300 |
| 12 | 200 |
2. On a graph with quantity on the horizontal axis and price on the vertical axis, which ordered pair plots the row for a price of $10?
- (10, 300)
- (300, 10)
- (300, 300)
- (10, 10)
Show the answer
An ordered pair lists the horizontal value first: 300 tickets across, then $10 up.
- (10, 300): This puts the price first, which would place price on the horizontal axis.
- Correct: (300, 10): Right: horizontal value (300 tickets) first, vertical value ($10) second.
- (300, 300): Both numbers are the quantity; the price of $10 is missing.
- (10, 10): Both numbers are the price; the 300 tickets are missing.
3. What kind of relationship does the table show between the price of a ticket and the number of tickets sold?
- An inverse relationship: as price rises, tickets sold fall
- A direct relationship: as the price rises, tickets sold rise
- No relationship: tickets sold do not depend on price
- A relationship that rises and then falls
Show the answer
Each $2 rise in price comes with 100 fewer tickets sold, so the two move in opposite directions.
- Correct: An inverse relationship: as price rises, tickets sold fall: Right: the variables move in opposite directions.
- A direct relationship: as the price rises, tickets sold rise: In a direct relationship both would rise together; here tickets fall as price rises.
- No relationship: tickets sold do not depend on price: Tickets sold change in every row as price changes.
- A relationship that rises and then falls: Tickets sold fall in every row; they never turn back up.
4. Using the table, by how many tickets a day do sales fall when the price rises from $8 to $12?
Type a number. A four-function calculator is allowed, as on the exam.
Show the answer
At $8 the theater sells 400 tickets and at $12 it sells 200: fewer tickets.
- Answer: 200
5. As the outdoor temperature rises over a week, a cafe sells fewer cups of hot chocolate. Which statement describes these two variables?
- They have a direct relationship, moving together
- They have no relationship
- They have an inverse relationship
- Temperature depends on cups sold
Show the answer
One rises while the other falls, which is an inverse (negative) relationship.
- They have a direct relationship, moving together: A direct relationship means both rise or both fall together.
- They have no relationship: Sales change as the temperature changes, so they are related.
- Correct: They have an inverse relationship: Right: higher temperature comes with fewer cups sold.
- Temperature depends on cups sold: The cafe sales follow the weather, not the other way round.
6. A student draws a market graph with Quantity up the side and Price across the bottom, and labels everything else correctly. What happens to the labeling point?
- It is earned, because both axes carry a label
- It is earned if the curves are drawn neatly
- It is lost only if the curves are unlabeled too
- It is lost, because the axes are swapped from the standard graph
Show the answer
A market graph puts Price on the vertical axis and Quantity on the horizontal axis. Swapped axes are wrong axes.
- It is earned, because both axes carry a label: A label must be the right one on the right axis, not just present.
- It is earned if the curves are drawn neatly: Neat curves do not fix swapped axes.
- It is lost only if the curves are unlabeled too: The axes alone are enough to lose the point.
- Correct: It is lost, because the axes are swapped from the standard graph: Right: the standard axes are part of the point.
Part 7 · Summary
Summary
Part 8 · Up next
What comes next
Part 9 · Connections