Population Growth and Resource Availability
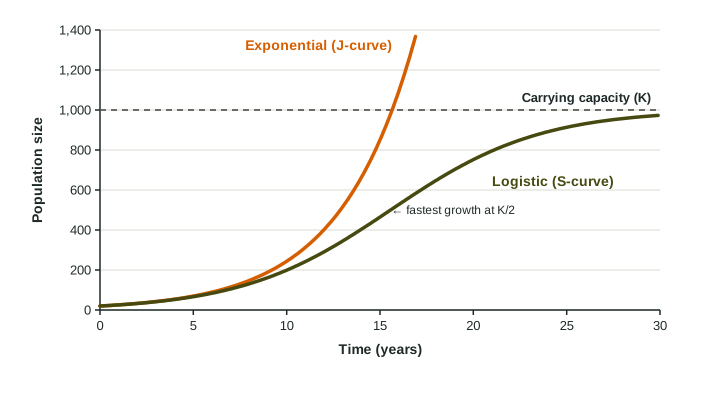
With unlimited resources, a population grows exponentially (a J-curve), by a constant percent each period.
Part 1 · Hook
Why this matters
Part 2 · Before you start
What this builds on
Part 3 · Prerequisite check
Quick check before you start
1. What is carrying capacity?
- The largest population an environment can support over time
- The fastest a population can grow
- The number of species in an area
- The age when a species first breeds
Show the answer
Carrying capacity (K) is set by an environment’s resources.
- Correct: The largest population an environment can support over time:
- The fastest a population can grow:
- The number of species in an area:
- The age when a species first breeds:
2. A population grows 7% a year. About how long does it take to double, by the rule of 70?
- 10 years
- 7 years
- 70 years
- 0.1 years
Show the answer
70 divided by the growth rate in percent: 70 / 7 = 10 years.
- Correct: 10 years:
- 7 years:
- 70 years:
- 0.1 years:
Part 4 · See it
See it first
Part 5 · Step by step
How it works, step by step
- Resources are plentiful and nothing limits a populationit grows by a constant percent each year, so it adds more individuals each year: exponential growth, a J-curve
- The population grows and resources are shared among more individualslimiting factors such as food, space and disease become stronger
- Births fall and deaths rise as the population nears carrying capacitygrowth slows and the population levels off at K: logistic growth, an S-curve
Part 6 · Key ideas
Key ideas
- Exponential growth: with unlimited resources, a population grows by a constant percent each period, so it adds more individuals each time. The graph is a J-curve.
- Logistic growth: growth is fast at first, slows as resources run short, and levels off at the carrying capacity. The graph is an S-curve; growth is fastest at about half of K.
- A limiting factor is any resource or condition that keeps a population from growing: food, water, space, light, nutrients, predators, disease.
- Density-dependent factors grow stronger as a population gets denser (food shortage, disease, competition, predation). Density-independent factors hit a population whatever its size (a flood, a frost, a fire).
Part 7 · Misconception
A common mistake
The wrong idea: A population growing exponentially adds the same number of individuals every year.
What actually happens: It grows by the same percent every year, so the number added grows each year: 2% of 1,000 is 20, but 2% of 2,000 is 40.
Part 8 · Check yourself
Check yourself
Exam-style questions. Anything you miss goes into your review queue.
Data
Yeast growing in a flask
| Time (hours) | Yeast cells per mL (thousands) |
|---|---|
| 0 | 10 |
| 2 | 20 |
| 4 | 40 |
| 6 | 80 |
| 8 | 150 |
| 10 | 240 |
| 12 | 300 |
| 14 | 320 |
| 16 | 325 |
1. During which period does the yeast population double every 2 hours?
- From 0 to 6 hours
- From 8 to 12 hours
- From 12 to 16 hours
- Over the whole 16 hours
Show the answer
Steady doubling is the sign of exponential growth.
- Correct: From 0 to 6 hours: Right: 10, 20, 40, 80 thousand cells per mL, doubling each 2 hours.
- From 8 to 12 hours: From 150 to 240 to 300, growth is slowing, not doubling.
- From 12 to 16 hours: The population is leveling off: 300, 320, 325.
- Over the whole 16 hours: Doubling stops after about 6 hours.
2. Which statement best describes the shape of the whole yeast growth curve?
- A J-curve that rises faster and faster to the end
- An S-curve leveling off near 325 thousand cells per mL
- A straight line rising at a steady rate
- A curve that rises and then crashes to zero
Show the answer
Rapid growth that slows and levels off is logistic.
- A J-curve that rises faster and faster to the end: After 8 hours growth slows, so it is not a J-curve throughout.
- Correct: An S-curve leveling off near 325 thousand cells per mL: Right: fast early growth, then slowing, then a plateau: logistic growth.
- A straight line rising at a steady rate: Growth is not steady: it speeds up, then slows.
- A curve that rises and then crashes to zero: The population levels off; it does not crash in these 16 hours.
3. Which explanation best accounts for the yeast population leveling off after 12 hours?
- The yeast cells stop dividing once they are 12 hours old
- The flask gets colder each hour of the experiment
- Sugar runs low and wastes build up
- Yeast stop growing at a set 300 thousand cells per mL
Show the answer
A population levels off when limiting factors strengthen as it grows.
- The yeast cells stop dividing once they are 12 hours old: Cells keep dividing when there is food; age is not the limit.
- The flask gets colder each hour of the experiment: Nothing suggests the temperature changed.
- Correct: Sugar runs low and wastes build up: Right: density-dependent limits (food and waste) slow growth near carrying capacity.
- Yeast stop growing at a set 300 thousand cells per mL: The level depends on the flask’s resources, not a fixed number.
Model or diagram
Two growth curves
4. On the figure, at about what population size does the logistic curve grow fastest?
- About 1,000, at the carrying capacity
- About 20, at the start
- About 1,400, at the top of the graph
- About 500, half the carrying capacity
Show the answer
Logistic growth is fastest at about half of K.
- About 1,000, at the carrying capacity: At K the curve is flat; growth has stopped.
- About 20, at the start: At the start the curve is low and flat; few individuals means few added.
- About 1,400, at the top of the graph: The logistic curve never reaches 1,400.
- Correct: About 500, half the carrying capacity: Right: the logistic curve is steepest at about K/2, marked on the figure.
5. Both curves start at 20 and match for the first few years. Why do they separate later?
- Limits slow the S-curve near K
- The J-curve species has a lower biotic potential
- The S-curve species dies out after 15 years
- The J-curve stops growing once it reaches the carrying capacity
Show the answer
When a population is small, limits barely matter, so logistic growth looks exponential.
- Correct: Limits slow the S-curve near K: Right: limiting factors bend the logistic curve; the exponential curve assumes no limits.
- The J-curve species has a lower biotic potential: Both start with the same growth; the J-curve is not slower.
- The S-curve species dies out after 15 years: The S-curve levels off near 1,000; it does not die out.
- The J-curve stops growing once it reaches the carrying capacity: The J-curve passes 1,000 and keeps rising.
6. A herd of 400 elk lives in a valley of 25 square kilometers. What is its population density?
Type a number, then its unit (elk/km^2). Scale words (2.5 million) and powers of ten (2.5 × 10^6) are read.
Show the answer
Number over area: elk per km².
- Answer: 16 elk/km^2
7. Which factor is density-independent?
- A disease that spreads faster in crowded herds
- Competition among birds for the few nesting sites
- A late frost that kills plants
- Predators that hunt more where prey is dense
Show the answer
Density-independent factors act no matter how many individuals there are.
- A disease that spreads faster in crowded herds: Spread through crowding makes disease density-dependent.
- Competition among birds for the few nesting sites: Competition gets stronger as density rises: density-dependent.
- Correct: A late frost that kills plants: Right: a frost acts on the population regardless of its density.
- Predators that hunt more where prey is dense: Predation that tracks prey density is density-dependent.
Part 9 · Summary
Summary
Part 10 · Up next
What comes next
Part 11 · Connections