
The question
Name: ______________________ Date: ____________ A land-use map and a distance table: how well von Thünen fits a real region (7 points)
Map
Source 1: Main farm land use by province, Country A
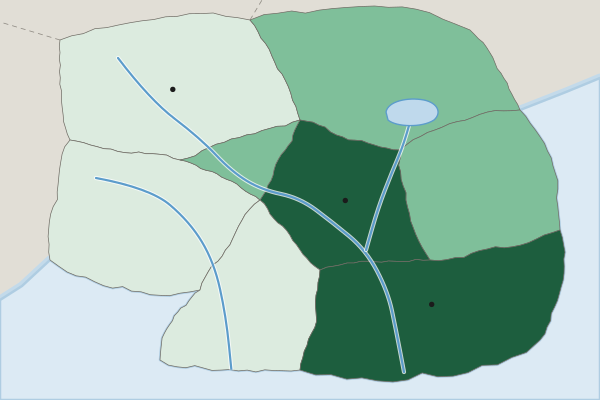
Main farm land use (invented)
- Livestock ranching
- Grain and field crops
- Market gardening and dairy
Data
Source 2: Distance and land value by province, Country A
| Province | Distance from the capital city (km) | Average farmland value (US dollars per hectare) | Notes |
|---|---|---|---|
| Capital Region | 0 to 30 | 12,000 | The country's largest market |
| Central Valley | 40 | 6,000 | Flat, good soil |
| Eastern Plains | 60 | 4,500 | Flat, good soil |
| Lake District | 70 | 4,000 | Rail line to the capital |
| Western Uplands | 120 | 1,200 | Hilly |
| Southern Forest | 130 | 1,000 | Hilly, wooded |
| South Coast | 140 | 9,000 | Mild winters; port with refrigerated shipping to export markets |
| Northern Hills | 150 | 800 | Hilly, dry |
Invented data for practice.
(A) Identify Identify the scale of analysis of the data shown in Source 1. [1 point]
Identify means: Give the information asked for: a word or short phrase can earn the point, with no reasons needed.
(B) Describe Using both sources, describe how the main farm land use changes with distance from the capital city. [1 point]
Describe means: Give the relevant characteristics: what it is like, where and how much. A name alone earns nothing.
(C) Explain Explain why the von Thünen model predicts market gardening and dairy in the Capital Region. [1 point]
Explain means: Say how or why, with every link of the chain: a cause, then because or so, then its effect, tied to the place or data asked about.
(D) Explain Using Source 2, explain how farmland value changes with distance from the capital city. [1 point]
Explain means: Say how or why, with every link of the chain: a cause, then because or so, then its effect, tied to the place or data asked about.
(E) Compare Compare the South Coast with the Northern Hills, using both sources. [1 point]
Compare means: Give a similarity or a difference and say it about both things, not one.
(F) Explain Explain one reason the South Coast does not fit the von Thünen model. [1 point]
Explain means: Say how or why, with every link of the chain: a cause, then because or so, then its effect, tied to the place or data asked about.
(G) Explain the degree Explain the degree to which the von Thünen model fits land use in Country A. [1 point]
Explain the degree means: State the degree first (to a high, moderate or low degree), then explain why with evidence.