Ecological Tolerance
Every species has a range of tolerance for each abiotic factor.
Part 1 · Hook
Why this matters
Part 2 · Before you start
What this builds on
Part 3 · Prerequisite check
Quick check before you start
1. Which of these is an abiotic factor in a stream?
- Water temperature
- Algae on the rocks
- Trout
- Mayfly larvae
Show the answer
Abiotic factors are nonliving: temperature, light, water, salinity. Algae, trout and mayflies are biotic.
- Correct: Water temperature:
- Algae on the rocks:
- Trout:
- Mayfly larvae:
2. Which change usually lowers the amount of dissolved oxygen that water can hold?
- Warmer water
- Colder water
- Faster-flowing water
- More plants making oxygen
Show the answer
Warm water holds less dissolved oxygen than cold water.
- Correct: Warmer water:
- Colder water:
- Faster-flowing water:
- More plants making oxygen:
Part 4 · See it
See it first
Part 5 · Step by step
How it works, step by step
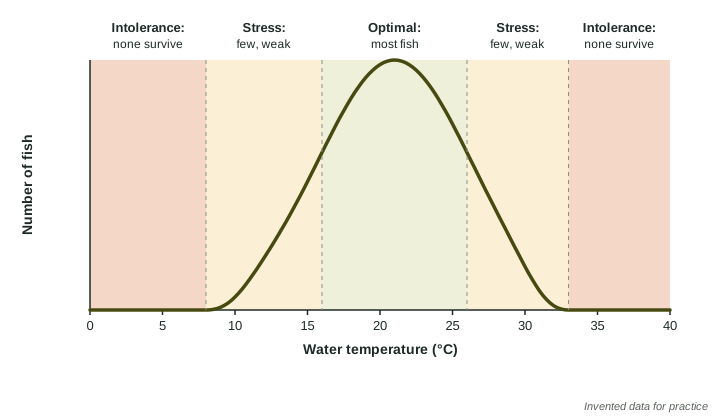
- An abiotic factor, such as temperature, moves out of a species’ optimal rangeindividuals enter a zone of physiological stress: they grow, feed or reproduce less
- Stress lasts or the factor moves further outfewer individuals survive and reproduce, so the population shrinks
- The factor passes the limit of toleranceindividuals die (the zone of intolerance), and the population disappears from that place or moves
Part 6 · Key ideas
Key ideas
- Each species has a range of tolerance for each abiotic factor (temperature, salinity, light, water): the conditions it can survive in.
- Inside the range, the optimal range is where individuals grow and reproduce best, and the population is largest.
- Toward the edges are zones of physiological stress: individuals survive but feed, grow or reproduce poorly, so the population is small. Beyond the limits lie zones of intolerance, where none survive.
- Tolerance applies to individuals and to whole populations. Individuals in a population vary, so some tolerate a little more than others.
Part 7 · Misconception
A common mistake
The wrong idea: If a fish survives in water that is too warm, it is doing fine.
What actually happens: Surviving is not thriving. In the zone of physiological stress fish live but eat, grow and reproduce less, so the population shrinks even before any fish die.
Part 8 · Check yourself
Check yourself
Exam-style questions. Anything you miss goes into your review queue.
Model or diagram
A fish species’ range of tolerance
1. According to the figure, what is the optimal range of water temperature for this fish?
- 16 to 26 °C
- 8 to 33 °C
- 0 to 8 °C
- 26 to 33 °C
Show the answer
The optimal range is the middle band where the population is largest.
- Correct: 16 to 26 °C: Right: the curve is highest between 16 and 26 °C, labeled optimal.
- 8 to 33 °C: That is the whole range of tolerance, including the zones of stress.
- 0 to 8 °C: No fish survive below 8 °C; that is a zone of intolerance.
- 26 to 33 °C: That is a zone of physiological stress, where few fish live.
2. The water in a lake warms from 22 °C to 30 °C over one summer. Which zone does the fish population move into?
- The optimal range
- A stress zone
- A zone of intolerance
- A zone that lies off the edge of the graph
Show the answer
Read the temperature on the x-axis, then the label of the band it falls in.
- The optimal range: 30 °C is above the optimal range, which ends at 26 °C.
- Correct: A stress zone: Right: 30 °C lies between 26 and 33 °C, a stress zone.
- A zone of intolerance: Intolerance starts above 33 °C, and 30 °C is below that.
- A zone that lies off the edge of the graph: The graph runs from 0 to 40 °C, so 30 °C is on it.
3. Which statement best explains why the curve is low but above zero between 26 and 33 °C?
- No fish can survive at those temperatures
- Fish grow fastest at those temperatures
- Fish survive but feed and breed poorly, so few remain
- Those temperatures are rare in lakes and streams in nature
Show the answer
Low but not zero means survival with stress.
- No fish can survive at those temperatures: That describes the zone of intolerance, where the curve is zero.
- Fish grow fastest at those temperatures: Growth is best in the optimal range, where the curve is highest.
- Correct: Fish survive but feed and breed poorly, so few remain: Right: the stress zone has living fish, but conditions keep the population small.
- Those temperatures are rare in lakes and streams in nature: The graph is about how fish respond, not how often a temperature occurs.
4. A factory would release heated water that keeps one bay at 35 °C all summer. What does the figure predict for this fish species in that bay?
- It would grow faster, because warm water holds more food
- It would not change, because fish can swim to cooler water
- It would shift into its optimal range for temperature
- It would vanish, as 35 °C is in a zone of intolerance
Show the answer
Past the upper limit of tolerance, a species cannot live in a place.
- It would grow faster, because warm water holds more food: Above 33 °C the figure shows no fish at all.
- It would not change, because fish can swim to cooler water: Some could leave, but the bay itself would no longer hold the species; the figure shows zero at 35 °C.
- It would shift into its optimal range for temperature: The optimal range is 16 to 26 °C, far below 35 °C.
- Correct: It would vanish, as 35 °C is in a zone of intolerance: Right: above 33 °C none survive, so the population would die or leave.
Data
Snail survival at different salinities
| Salinity (ppt) | Snails alive after 10 days (%) | Snails that laid eggs (%) |
|---|---|---|
| 0 | 0 | 0 |
| 5 | 40 | 5 |
| 10 | 85 | 30 |
| 15 | 95 | 70 |
| 20 | 96 | 72 |
| 25 | 90 | 35 |
| 30 | 45 | 5 |
| 35 | 0 | 0 |
5. Based on the table, what is the optimal range of salinity for these snails?
- About 15 to 20 ppt
- About 0 to 35 ppt
- About 5 to 30 ppt
- About 25 to 35 ppt
Show the answer
The optimal range is where individuals both survive and reproduce best.
- Correct: About 15 to 20 ppt: Right: survival is highest and egg laying peaks at 70% and 72% there.
- About 0 to 35 ppt: At 0 and 35 ppt no snails survive; those are the limits.
- About 5 to 30 ppt: That is the range where some survive, including the stress zones where few lay eggs.
- About 25 to 35 ppt: Survival and egg laying fall at 25 ppt and above.
6. In which part of a range of tolerance do individuals grow and reproduce best?
- A zone of physiological stress
- A zone of intolerance
- The upper limit of tolerance
- The optimal range
Show the answer
Optimal range: thrive. Stress zone: survive poorly. Intolerance: die.
- A zone of physiological stress: Individuals survive but grow and reproduce poorly there.
- A zone of intolerance: Individuals die there.
- The upper limit of tolerance: At the limit, survival ends.
- Correct: The optimal range: Right: the population is largest there.
Part 9 · Summary
Summary
Part 10 · Up next
What comes next
Part 11 · Connections