Population Genetics
A population's gene pool is all its alleles, and an allele's frequency is its share of all copies of that gene; a change in allele frequencies over generations is microevolution.
Part 1 · Hook
Why this matters
Around 1775 a typhoon swept over Pingelap, a tiny Pacific atoll, and only about 20 people survived the storm and the famine after it. One survivor happened to carry a rare recessive allele that causes complete color blindness. Today roughly 1 in 10 Pingelapese people is born with it, compared with about 1 in 30,000 in most populations. The allele did not help anyone survive. It became common by chance, because so few people passed on their alleles. This is genetic drift.
Part 2 · Before you start
What this builds on
Part 3 · Prerequisite check
Quick check before you start
1. An individual who is heterozygous for a gene carries
- two different alleles of that gene
- two copies of the dominant allele
- one copy of the gene instead of two
Show the answer
Heterozygous means the two copies of the gene, one from each parent, are different alleles.
- Correct: two different alleles of that gene:
- two copies of the dominant allele:
- one copy of the gene instead of two:
2. In natural selection, the alleles that become more common are those that
- raise survival or reproduction in the current environment
- arise most often by mutation
- individuals need most
Show the answer
Selection is not random: it favors alleles whose carriers leave more surviving offspring.
- Correct: raise survival or reproduction in the current environment:
- arise most often by mutation:
- individuals need most:
3. Why do resistant bacteria become common after an antibiotic is used?
- The drug kills susceptible cells, so cells that already carried resistance multiply
- The drug causes resistance mutations
- Bacteria learn to avoid the drug
Show the answer
The antibiotic is a selective pressure acting on variation that already existed.
- Correct: The drug kills susceptible cells, so cells that already carried resistance multiply:
- The drug causes resistance mutations:
- Bacteria learn to avoid the drug:
Part 4 · See it
See it first
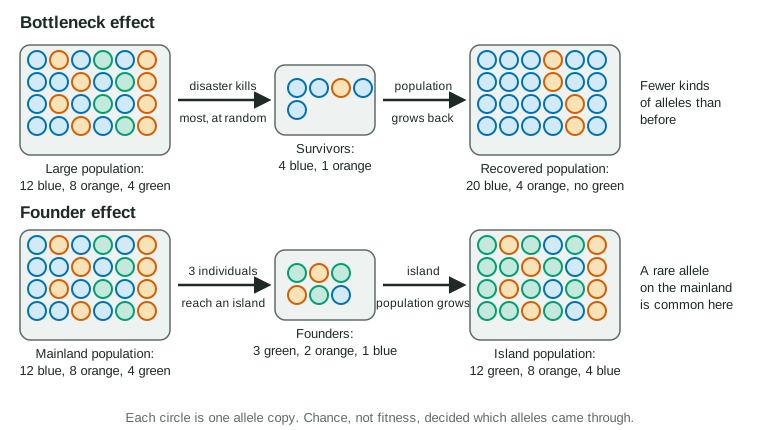
Part 5 · Step by step
How it works, step by step
- Every population has a gene pool, and each allele in it has a frequency, the share of all copies of that gene that are that allele.Evolution can be measured as a change in allele frequencies from one generation to the next: microevolution.
- Mutation creates new alleles, rarely, in every generation.The gene pool gains variation that other processes can act on.
- Only some individuals reproduce, and each passes on a random half of its alleles.Allele frequencies change by chance from generation to generation: genetic drift.
- The fewer individuals that breed, the less closely their alleles match the whole population, as in a bottleneck or a founder event.Drift is strongest in small populations, where alleles can be lost or fixed within a few generations, whatever their effect on fitness.
- Alleles are lost from small populations, and individuals or pollen move between populations (gene flow).Small, isolated populations lose genetic variation and become less able to respond to change; gene flow restores variation and makes populations more alike.
Part 6 · Key ideas
Key ideas
- A gene pool is all the alleles in a population. Allele frequency = copies of that allele ÷ all copies of the gene; for diploids, (2 × AA + Aa) ÷ (2 × N). Microevolution is a change in allele frequencies.
- Mutation is the source of new alleles; it is slow but supplies all variation.
- Genetic drift is random change in allele frequencies, strongest when population size is small. The bottleneck effect and founder effect are drift after a crash or a new start.
- Gene flow (immigration and emigration of alleles) makes populations more alike and can add alleles. Nonrandom mating such as inbreeding raises homozygosity without, by itself, changing allele frequencies.
- Drift in small populations causes loss of genetic variation, which leaves a population less able to adapt when its environment changes.
Part 7 · Misconception
A common mistake
The wrong idea: If an allele becomes more common in a population, it must have helped its carriers survive.
What actually happens: Allele frequencies also change by chance. In a small population, genetic drift can make a harmful allele common, as on Pingelap, or wipe out a helpful one. Only natural selection changes frequencies because of an allele's effect on fitness.
Part 8 · Check yourself
Check yourself
Exam-style questions. Anything you miss goes into your review queue.
Graph
Allele frequency over generations in small and large populations
Researchers set up five laboratory populations of fruit flies from one stock in which the frequency of an eye-color allele, e, was 0.50. The allele has no known effect on survival or reproduction in the lab. Each generation, a set number of adults was taken at random to be the parents of the next generation: 10 adults in each of the small populations S1, S2 and S3, and 500 adults in each of the large populations L1 and L2. All populations were kept on the same food at the same temperature. The graph shows the frequency of e among the parents of each generation.
S1 (10 adults)S2 (10 adults)S3 (10 adults)L1 (500 adults)L2 (500 adults)
Data table
| Generation | S1 (10 adults) | S2 (10 adults) | S3 (10 adults) | L1 (500 adults) | L2 (500 adults) |
|---|---|---|---|---|---|
| 0 | 0.5 | 0.5 | 0.5 | 0.5 | 0.5 |
| 1 | 0.3 | 0.35 | 0.6 | 0.49 | 0.46 |
| 2 | 0.3 | 0.25 | 0.65 | 0.49 | 0.46 |
| 3 | 0.5 | 0.25 | 0.6 | 0.49 | 0.47 |
| 4 | 0.65 | 0.3 | 0.65 | 0.51 | 0.47 |
| 5 | 0.55 | 0.3 | 0.3 | 0.52 | 0.47 |
| 6 | 0.7 | 0.15 | 0.25 | 0.51 | 0.47 |
| 7 | 0.85 | 0.15 | 0.3 | 0.51 | 0.49 |
| 8 | 0.85 | 0.15 | 0.35 | 0.51 | 0.52 |
| 9 | 0.8 | 0.05 | 0.3 | 0.51 | 0.54 |
| 10 | 0.8 | 0.05 | 0.4 | 0.52 | 0.54 |
| 11 | 0.85 | 0 | 0.25 | 0.51 | 0.53 |
| 12 | 0.85 | 0 | 0.4 | 0.54 | 0.54 |
| 13 | 0.9 | 0 | 0.4 | 0.54 | 0.54 |
| 14 | 0.9 | 0 | 0.25 | 0.56 | 0.54 |
| 15 | 1 | 0 | 0.2 | 0.54 | 0.51 |
| 16 | 1 | 0 | 0.2 | 0.52 | 0.5 |
| 17 | 1 | 0 | 0.25 | 0.52 | 0.48 |
| 18 | 1 | 0 | 0.3 | 0.53 | 0.45 |
| 19 | 1 | 0 | 0.5 | 0.52 | 0.47 |
| 20 | 1 | 0 | 0.4 | 0.51 | 0.48 |
1. Which statement best describes the data?
- The small populations swung widely, and two reached 0 or 1; the large ones stayed near 0.5.
- Frequencies in each population rose toward 1 over time, but the small populations got there sooner.
- The small populations stayed near 0.5, while the large populations swung widely between 0.4 and 0.6.
- Frequencies in the small populations fell toward 0, while those in the large populations rose toward 1.
Show the answer
S1 reached 1 by generation 15 and S2 reached 0 by generation 11, while S3 wandered between 0.2 and 0.65; L1 and L2 stayed between about 0.45 and 0.56.
- Correct: The small populations swung widely, and two reached 0 or 1; the large ones stayed near 0.5.: Correct: wide random swings in the small populations, little change in the large ones.
- Frequencies in each population rose toward 1 over time, but the small populations got there sooner.: S2 fell to 0 and S3 ended at 0.4, so not every population rose toward 1.
- The small populations stayed near 0.5, while the large populations swung widely between 0.4 and 0.6.: This reverses the populations: the small ones swung widely, the large ones barely moved.
- Frequencies in the small populations fell toward 0, while those in the large populations rose toward 1.: S1 rose to 1 while S2 fell to 0, and both large populations stayed near 0.5, so there is no common direction.
2. Which explanation best accounts for the difference between the small and the large populations?
- Ten parents carry 20 copies of the gene, a small sample that strays from the last generation by chance far more than 1,000 copies do.
- The allele helps flies survive in small populations but harms them in large ones, so natural selection pushes the frequencies apart.
- Flies in small populations mutate more often, so the eye-color allele is created and destroyed more often in them.
- The large populations exchanged flies with one another, which kept their allele frequencies close to 0.5.
Show the answer
This is genetic drift. Each generation is a random sample of the last one's alleles, and small samples stray much further from the true proportion than large ones, just as 10 coin tosses stray from half heads more than 1,000 do.
- Correct: Ten parents carry 20 copies of the gene, a small sample that strays from the last generation by chance far more than 1,000 copies do.: Correct: the size of the random sample sets how strong drift is.
- The allele helps flies survive in small populations but harms them in large ones, so natural selection pushes the frequencies apart.: The allele has no known effect on fitness, and two small populations went in opposite directions, which selection would not do.
- Flies in small populations mutate more often, so the eye-color allele is created and destroyed more often in them.: Mutation rates do not depend on population size, and mutation is far too rare to move frequencies this fast.
- The large populations exchanged flies with one another, which kept their allele frequencies close to 0.5.: The stimulus describes separate populations with no exchange of flies.
3. A student claims that allele e was favored by natural selection in population S1. Which evidence from the experiment best refutes this claim?
- Population S2, of the same size and in the same conditions, lost allele e.
- Allele e reached a frequency of 1 in population S1 by generation 15 of the experiment.
- Population S1's frequency of allele e fell from 0.5 to 0.3 in the very first generation.
- The large populations both ended the experiment with frequencies close to 0.5.
Show the answer
Selection in identical conditions would push the same allele the same way in every population. S1 rising to 1 while S2, identical in size and conditions, fell to 0 shows the direction was random: drift.
- Correct: Population S2, of the same size and in the same conditions, lost allele e.: Correct: opposite outcomes in identical replicates point to chance.
- Allele e reached a frequency of 1 in population S1 by generation 15 of the experiment.: Reaching 1 is what the student's claim predicts, so it does not refute it.
- Population S1's frequency of allele e fell from 0.5 to 0.3 in the very first generation.: One early dip is consistent with either drift or weak selection, so it is weak evidence.
- The large populations both ended the experiment with frequencies close to 0.5.: Large populations staying near 0.5 fits no strong selection, but the two small populations are the more direct test, because they differ only by chance.
Data table
A shrinking population of grassland birds
A grassland bird once lived across a whole state. As its prairie was plowed, one remaining population became cut off from all others by many kilometers of farmland. Researchers counted displaying males each spring, recorded the percentage of eggs that hatched in nests they monitored, and estimated genetic variation from the average number of alleles per gene at six genes, using DNA from feathers. Between 1992 and 1996 they released 270 birds caught in three large populations in other states. (Values are simplified for teaching.)
| Year | Displaying males | Eggs that hatched (%) | Alleles per gene (mean of 6 genes) |
|---|---|---|---|
| 1960 | 2,000 | 93 | 5.2 |
| 1975 | 300 | 85 | 4.5 |
| 1990 | 40 | 56 | 3.1 |
| 1992-1996 | 270 birds released from other states | — | — |
| 1999 | 70 | 92 | 5.0 |
4. Which explanation best accounts for the fall in hatching success between 1960 and 1990?
- In a small isolated group, drift and matings among relatives made harmful recessive alleles homozygous more often.
- Birds in the small population chose to lay fewer eggs in each nest, so a smaller share of the eggs hatched.
- The loss of prairie caused mutations in the birds that made their eggs less likely to hatch.
- Fewer males displayed each spring, so many females could not find mates and laid unfertilized eggs instead.
Show the answer
As the population shrank to a few dozen birds, drift raised some harmful recessive alleles to high frequencies, and close relatives mated more often. More embryos were homozygous for these alleles and failed to develop.
- Correct: In a small isolated group, drift and matings among relatives made harmful recessive alleles homozygous more often.: Correct: small size raised homozygosity for harmful recessive alleles.
- Birds in the small population chose to lay fewer eggs in each nest, so a smaller share of the eggs hatched.: Clutch size does not determine what percentage of laid eggs hatch.
- The loss of prairie caused mutations in the birds that made their eggs less likely to hatch.: Plowing does not cause particular mutations; the problem was the alleles already present becoming homozygous.
- Fewer males displayed each spring, so many females could not find mates and laid unfertilized eggs instead.: Seventy displaying males in 1999 gave 92% hatching, so the number of males alone does not explain the failures.
5. Which process best explains the changes between 1990 and 1999?
- Gene flow from the released birds restored lost alleles, so fewer embryos were homozygous for harmful ones.
- The released birds outcompeted the local birds, so the local birds' alleles disappeared and were replaced.
- Natural selection in the local population produced new alleles that let a larger share of the eggs hatch.
- The larger number of birds raised the mutation rate, so genetic variation came back within a few years of release.
Show the answer
The released birds came from large populations that still held many alleles. Breeding with them raised alleles per gene from 3.1 to 5.0 and made offspring heterozygous at more genes, masking harmful recessive alleles.
- Correct: Gene flow from the released birds restored lost alleles, so fewer embryos were homozygous for harmful ones.: Correct: gene flow restored variation and lowered homozygosity.
- The released birds outcompeted the local birds, so the local birds' alleles disappeared and were replaced.: The released birds bred with local birds; nothing shows the local alleles disappeared.
- Natural selection in the local population produced new alleles that let a larger share of the eggs hatch.: Selection does not create alleles, and mutation is far too slow to add this many in a few years.
- The larger number of birds raised the mutation rate, so genetic variation came back within a few years of release.: Mutation rates do not rise with population size, and mutation adds alleles far too slowly to explain this.
6. In a sample of 50 deer mice, 20 are DD, 10 are Dd and 20 are dd. A student calculates the frequency of allele d as 20 ÷ 50 = 0.40. What is the correct frequency, and what did the student miss?
- 0.50; the d alleles carried by the 10 heterozygotes, and the fact that each mouse has two copies
- 0.40; the student's method is correct for any population with a recessive allele
- 0.60; the student forgot to add the heterozygotes to the dd mice without halving them
- 0.20; the student should have divided by the total number of alleles, 100, without other changes
Show the answer
Copies of d = (2 × 20) + 10 = 50, out of 2 × 50 = 100 copies, so the frequency is 0.50. Dividing dd mice by all mice gives the share of one genotype, not the allele frequency.
- Correct: 0.50; the d alleles carried by the 10 heterozygotes, and the fact that each mouse has two copies: Correct: count alleles, not individuals.
- 0.40; the student's method is correct for any population with a recessive allele: 20 ÷ 50 is the share of dd mice, which leaves out the d alleles in heterozygotes.
- 0.60; the student forgot to add the heterozygotes to the dd mice without halving them: (20 + 10) ÷ 50 = 0.60 counts each heterozygote as a whole d, double-counting its one copy.
- 0.20; the student should have divided by the total number of alleles, 100, without other changes: Dividing by 100 is right, but the d count must include both copies in each dd mouse and the one in each Dd mouse: 50, not 20.
7. A recessive form of dwarfism with extra fingers is far more common among the Old Order Amish of Lancaster County, Pennsylvania, than in most populations. This community descends from a few hundred settlers who arrived in the 1700s and mostly married within the community. Which explanation best fits?
- Founder effect: a founder happened to carry the rare allele, and it became common in the small population.
- Natural selection: the allele helped carriers survive the conditions of farm life in Pennsylvania.
- Gene flow: the allele was brought in repeatedly by people who joined the community from outside.
- Mutation: the community's farming way of life raised the rate of this particular mutation in its families.
Show the answer
A few hundred founders are a small sample of the European population they came from. One couple happened to carry the allele, and with few founders and marriages within the community, it reached a high frequency by drift.
- Correct: Founder effect: a founder happened to carry the rare allele, and it became common in the small population.: Correct: chance sampling at the founding, then drift in a small population.
- Natural selection: the allele helped carriers survive the conditions of farm life in Pennsylvania.: The allele causes a disorder; nothing suggests it raised fitness.
- Gene flow: the allele was brought in repeatedly by people who joined the community from outside.: The community mostly married within itself, which limits gene flow.
- Mutation: the community's farming way of life raised the rate of this particular mutation in its families.: Ways of life do not raise the rate of a particular mutation; the allele was present at the founding.
8. A grass population grows on soil polluted with copper at an old mine, where copper-tolerant plants survive far better. Wind blows large amounts of pollen onto the mine from a big population of the same grass on clean soil nearby, where tolerance gives no advantage. What is the most likely effect of this pollen on the mine population?
- It brings in copper-sensitivity alleles, so tolerance stays rarer on the mine than selection alone would make it.
- It makes the mine plants more copper-tolerant, because the pollen comes from a larger population of grass.
- It has no effect, because natural selection on the mine removes any sensitive seedlings at once.
- It causes the clean-soil plants to become copper-tolerant, because pollen carries tolerance away from the mine.
Show the answer
Gene flow mixes the two gene pools. Pollen from the clean-soil plants carries sensitivity alleles into the mine population each generation, opposing selection there, so tolerance stays less common, especially near the mine's edge.
- Correct: It brings in copper-sensitivity alleles, so tolerance stays rarer on the mine than selection alone would make it.: Correct: gene flow can work against local adaptation.
- It makes the mine plants more copper-tolerant, because the pollen comes from a larger population of grass.: The clean-soil plants mostly lack tolerance alleles, so their pollen lowers tolerance on the mine.
- It has no effect, because natural selection on the mine removes any sensitive seedlings at once.: Selection removes many sensitive seedlings, but new sensitive alleles keep arriving, so they are never all gone; the balance is lower tolerance.
- It causes the clean-soil plants to become copper-tolerant, because pollen carries tolerance away from the mine.: The wind carries pollen onto the mine, so little gene flow goes the other way, and tolerance gives no advantage on clean soil anyway.
Part 9 · Summary
Summary
A population's gene pool is all its alleles, and an allele's frequency is its share of all copies of that gene; a change in allele frequencies over generations is microevolution. Mutation supplies new alleles. Genetic drift changes allele frequencies at random, because which individuals breed and which alleles they pass on is partly chance; it is strongest in small populations, where alleles can be lost or fixed quickly whatever their effect on fitness. The bottleneck effect (after a population crashes) and the founder effect (when a few individuals start a new population) are drift in action. Gene flow moves alleles between populations, making them more alike. Nonrandom mating, such as inbreeding, raises the share of homozygotes without changing allele frequencies by itself. Small populations lose genetic variation, which makes them less able to respond to environmental change.
Part 10 · Up next
What comes next
Part 11 · Connections