Biodiversity
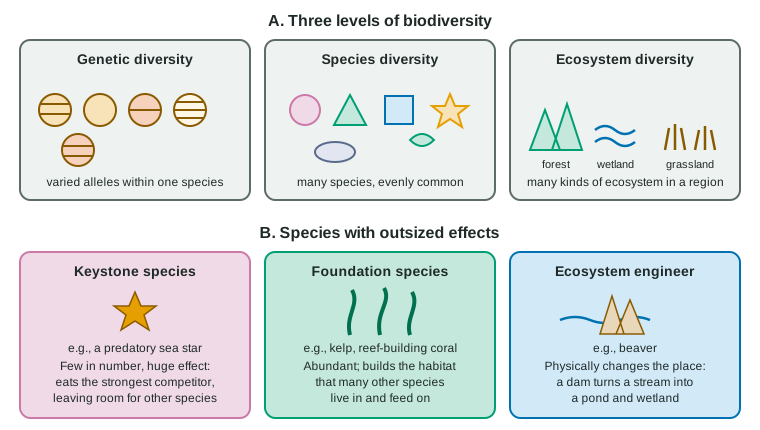
Biodiversity is the variety of life at three levels: the alleles within species, the species in a community and the ecosystems in a region.
Part 1 · Hook
Why this matters
In 1963, the ecologist Robert Paine started prying purple sea stars off a stretch of rocky shore in Washington State and throwing them into the sea, again and again for years. Next to it he left a stretch untouched. On the untouched rocks, about 15 species of barnacles, mussels, limpets and seaweeds lived side by side. Where the sea stars were gone, mussels spread over the rock, and within a few years only about 8 species were left. A single predator, never very common, had been holding the whole community together.
Part 2 · Before you start
What this builds on
Part 3 · Prerequisite check
Quick check before you start
1. Species diversity combines
- species richness and relative abundance (evenness)
- population size and growth rate
- the number of trophic levels and their energy
Show the answer
Diversity counts how many species there are and how evenly individuals are spread among them.
- Correct: species richness and relative abundance (evenness):
- population size and growth rate:
- the number of trophic levels and their energy:
2. In a trophic cascade, removing a top predator
- changes each level below it, alternately up and down
- changes only the predator's own prey
- has no effect on producers
Show the answer
Its prey increase, the prey's food decreases, and so on down the food web.
- Correct: changes each level below it, alternately up and down:
- changes only the predator's own prey:
- has no effect on producers:
3. Which process makes the offspring of sexually reproducing organisms genetically varied?
- Crossing over and independent assortment in meiosis, plus random fertilization
- Mitosis in body cells
- DNA replication without errors
Show the answer
Meiosis reshuffles alleles and fertilization combines two parents, producing genetic variation.
- Correct: Crossing over and independent assortment in meiosis, plus random fertilization:
- Mitosis in body cells:
- DNA replication without errors:
Part 4 · See it
See it first
Part 5 · Step by step
How it works, step by step
- A community has many species, and each species carries many different alleles.Its individuals and species differ in how they cope with a drought, a disease or a cold winter.
- A disruption harms the sensitive individuals and species.Tolerant ones survive and use the light, water and space the others leave, so some of each job in the ecosystem still gets done.
- Production, nutrient cycling and food supply drop less and bounce back sooner.Diverse ecosystems tend to be more stable and resilient than species-poor ones.
- A keystone predator eats the species that is the strongest competitor, such as mussels on a rocky shore.The strong competitor cannot take over, so many other species keep room to live.
- The keystone species is removed.The strong competitor excludes others, and diversity falls, though the keystone species itself was never abundant.
- Foundation species (kelp, coral, forest trees) and ecosystem engineers (beavers) build or change the habitat.Many other species depend on them, so losing them reshapes the whole community.
Part 6 · Key ideas
Key ideas
- Biodiversity has three levels: genetic diversity, species diversity and ecosystem diversity.
- Ecosystems with more species and more genetic variation tend to be more stable: they resist disruptions and recover faster (resilience), partly because some species can take over the jobs of others.
- A keystone species has an effect far larger than its numbers; removing it can collapse community structure.
- Foundation species build habitat by being abundant (kelp, corals, dominant trees); ecosystem engineers physically change it (beavers). Producers set what every level above can have.
- Ecosystem services, such as pollination, clean water and flood control, depend on biodiversity. Simpson's index lets you compare diversity with numbers (skill: Simpson's diversity index).
Part 7 · Misconception
A common mistake
The wrong idea: The most important species in a community is always the most common one.
What actually happens: A keystone species can be rare: sea stars were a small fraction of the animals on Paine's rocks, yet removing them halved the number of species. Importance comes from the species' role, not its numbers.
Part 8 · Check yourself
Check yourself
Exam-style questions. Anything you miss goes into your review queue.
Graph
Species on rocky-shore plots after a predator is removed
On a rocky shore, a predatory sea star eats mussels, barnacles and snails. Researchers marked ten 4 m² plots. From five plots they removed every sea star each month for six years; five control plots were left alone. Each year they counted the species of attached animals and seaweeds in each plot. Sea stars made up less than 1% of the animals counted. Mussels covered about 20% of the rock in every plot at the start; after six years they covered 85% of the removal plots and 15-25% of the control plots. Points are means of five plots.
Control plotsSea stars removed
Data table
| Time since removal began (years) | Control plots | Sea stars removed |
|---|---|---|
| 0 | 15 | 15 |
| 1 | 15 | 14 |
| 2 | 16 | 12 |
| 3 | 15 | 10 |
| 4 | 15 | 9 |
| 5 | 16 | 8 |
| 6 | 15 | 7 |
1. Which statement best describes the results?
- Species numbers fell in both kinds of plot, but more slowly in the control plots than in the removal plots.
- The control plots stayed at 15-16 species, while removal plots fell steadily from 15 to 7 species over six years.
- Removal plots lost most of their species in the first year and then held steady at about 14 species per plot after that.
- Removal plots gained species as the mussels spread, rising above the control plots by year 6.
Show the answer
Control plots held 15-16 species throughout; removal plots dropped each year: 15, 14, 12, 10, 9, 8, 7.
- Species numbers fell in both kinds of plot, but more slowly in the control plots than in the removal plots.: The control plots did not decline; they varied between 15 and 16.
- Correct: The control plots stayed at 15-16 species, while removal plots fell steadily from 15 to 7 species over six years.: Correct: a steady fall only where the sea stars were removed.
- Removal plots lost most of their species in the first year and then held steady at about 14 species per plot after that.: The removal plots lost 1 species in year 1 and kept declining to 7.
- Removal plots gained species as the mussels spread, rising above the control plots by year 6.: Removal plots lost species as mussels spread, ending at 7 against 15 in the controls.
2. Which explanation best accounts for the loss of species from the removal plots?
- Without sea stars eating them, mussels spread over the rock and crowded out species that need space to attach.
- Without sea stars, the snails and barnacles they ate became too numerous and starved, taking other species with them.
- Removing the sea stars disturbed the rock surface each month, which killed many of the attached species.
- Sea stars release nutrients in their wastes, and without them the seaweeds and animals had too little food.
Show the answer
The sea star keeps mussels, the strongest competitor for space, in check. Mussel cover rose from 20% to 85%, and the species that lost their space disappeared: competitive exclusion released by removing the predator.
- Correct: Without sea stars eating them, mussels spread over the rock and crowded out species that need space to attach.: Correct: the predator held down the dominant competitor.
- Without sea stars, the snails and barnacles they ate became too numerous and starved, taking other species with them.: The data show mussels taking over the rock, not prey starving.
- Removing the sea stars disturbed the rock surface each month, which killed many of the attached species.: Removing sea stars by hand is a small disturbance; the steady rise in mussel cover explains the losses better.
- Sea stars release nutrients in their wastes, and without them the seaweeds and animals had too little food.: Nothing in the data points to nutrients, and the loss tracks the spread of mussels.
Data table
Grassland plots with different numbers of plant species in a drought
Ecologists sowed 1 m² plots with 1, 2, 4, 8 or 16 grassland plant species, choosing the species for each plot at random from a pool of 18, with 30 plots of each kind. They measured the plant matter (biomass) above ground each summer. One summer brought a severe drought. Values are means ± 2 SE.
| Species sown per plot | Biomass the summer before the drought (g per m²) | Biomass lost in the drought (% of the summer before) | Biomass two years later (% of the summer before) |
|---|---|---|---|
| 1 | 180 ± 40 | 78 ± 10 | 62 ± 15 |
| 2 | 230 ± 35 | 65 ± 9 | 74 ± 12 |
| 4 | 290 ± 30 | 52 ± 8 | 85 ± 10 |
| 8 | 340 ± 28 | 41 ± 7 | 96 ± 8 |
| 16 | 380 ± 25 | 33 ± 6 | 101 ± 7 |
3. Which statement best describes the relationship shown in the table?
- Plots with more species produced less biomass but lost a larger share in the drought.
- Plots with more species lost a smaller share in the drought but were slower to return to their earlier biomass.
- Plots with more species produced more biomass, lost a smaller share in the drought and recovered more fully.
- Plots with different numbers of species lost similar shares of their biomass in the drought.
Show the answer
From 1 to 16 species, biomass rose (180 to 380 g per m²), drought loss fell (78% to 33%) and recovery after two years rose (62% to 101%).
- Plots with more species produced less biomass but lost a larger share in the drought.: Both trends are reversed: more species meant more biomass and a smaller loss.
- Plots with more species lost a smaller share in the drought but were slower to return to their earlier biomass.: Recovery was more complete with more species (101% vs 62%).
- Correct: Plots with more species produced more biomass, lost a smaller share in the drought and recovered more fully.: Correct: higher productivity, resistance and resilience with more species.
- Plots with different numbers of species lost similar shares of their biomass in the drought.: Losses ranged from 78% to 33%, a large difference.
4. Using the error bars (± 2 SE), which conclusion about drought losses is best supported?
- 8-species and 16-species plots differ clearly, because their means differ by 8 percentage points.
- 1-species and 16-species plots do not clearly differ, because both sets of error bars are large.
- 1-species and 16-species plots differ clearly, but 8-species and 16-species plots do not clearly differ.
- No two kinds of plot clearly differ, because each mean has an error bar around it.
Show the answer
1 species: 68-88%; 16 species: 27-39%. No overlap, so they clearly differ. 8 species: 34-48% overlaps 27-39%, so those two are not clearly different.
- 8-species and 16-species plots differ clearly, because their means differ by 8 percentage points.: The intervals 34-48% and 27-39% overlap, so this difference may be due to chance.
- 1-species and 16-species plots do not clearly differ, because both sets of error bars are large.: The intervals 68-88% and 27-39% are far apart.
- Correct: 1-species and 16-species plots differ clearly, but 8-species and 16-species plots do not clearly differ.: Correct: compare the ± 2 SE intervals for overlap.
- No two kinds of plot clearly differ, because each mean has an error bar around it.: Error bars that do not overlap, such as those for 1 and 16 species, indicate a clear difference.
5. Which explanation best accounts for the smaller drought losses in plots with many species?
- Plants in diverse plots shade the soil so well that drought does not reach their roots.
- Diverse plots are more likely to include drought-tolerant species that keep growing and use resources the others leave.
- Each species in a diverse plot grows more slowly, so each needs less water during a drought.
- Diverse plots were watered more often by the researchers to keep the many species alive.
Show the answer
Species differ in how they cope with drought. The more species a plot has, the more likely some are deep-rooted or drought-tolerant and can take over, so the plot as a whole loses less and recovers faster.
- Plants in diverse plots shade the soil so well that drought does not reach their roots.: Shading may help a little, but the plots still lost a third of their biomass, so the drought did reach them.
- Correct: Diverse plots are more likely to include drought-tolerant species that keep growing and use resources the others leave.: Correct: differences among species buffer the whole community.
- Each species in a diverse plot grows more slowly, so each needs less water during a drought.: Diverse plots produced more biomass, not less, so their plants were not growing more slowly.
- Diverse plots were watered more often by the researchers to keep the many species alive.: The design gave every plot the same treatment; nothing suggests extra watering.
6. In a meadow, removing species X (2% of the plant and animal biomass) cut the number of species by half, while removing species Y (40% of the biomass) cut it by 10%. Which conclusion is best supported?
- Y is a keystone species, because it makes up the most biomass in the meadow.
- Neither is a keystone species, because removing either one lowered richness.
- X is a keystone species, because its effect is far larger than its share of the biomass.
- Both are keystone species, because removing either one of them changed the whole community.
Show the answer
Keystone species are identified by an effect out of proportion to abundance: X, at 2% of biomass, halved richness.
- Y is a keystone species, because it makes up the most biomass in the meadow.: A species that is abundant and has a modest effect fits a dominant species, not a keystone.
- Neither is a keystone species, because removing either one lowered richness.: Lowering richness does not rule out a keystone role; X's effect is huge for its size.
- Correct: X is a keystone species, because its effect is far larger than its share of the biomass.: Correct: small share, large effect.
- Both are keystone species, because removing either one of them changed the whole community.: Nearly any removal changes a community a little; Y's effect is in line with its large share.
7. On a savanna, elephants push over and eat young trees, which keeps the land open and grassy. Zebras and wildebeest graze the grass. All elephants are removed from a large fenced reserve. Predict each quantity ten years later.
| Variable | Change |
|---|---|
| Number of trees | — |
| Area of open grassland | — |
| Number of grazing zebras and wildebeest | — |
| Yearly rainfall on the reserve | — |
Show the answer
Elephants act as ecosystem engineers, holding back trees. Without them, the savanna moves toward woodland, and the species that depend on open grassland decline.
- Number of trees: increases. Young trees are no longer pushed over and eaten, so more of them grow up.
- Area of open grassland: decreases. Growing trees shade out grass and take over space that was open.
- Number of grazing zebras and wildebeest: decreases. Less grass means less food for grazers.
- Yearly rainfall on the reserve: no change. Rainfall is set by regional weather, not by elephants in one reserve.
8. A banana variety grown worldwide for decades was propagated by cuttings, so every plant was a clone. A soil fungus spread through plantations and the variety was largely abandoned. Which explanation best accounts for the collapse?
- Clones grow more slowly than plants from seed, so the fungus overtook them.
- Bananas lack an immune system, so no banana plant can resist any fungus.
- Cuttings carry the fungus from parent to offspring, so each clone started life infected.
- Every plant had the same alleles, so none had a defense against the fungus.
Show the answer
With no genetic diversity, a pathogen that can infect one plant can infect them all; a varied population would likely include some resistant plants.
- Clones grow more slowly than plants from seed, so the fungus overtook them.: Growth rate is not the issue; susceptibility was shared by every plant.
- Bananas lack an immune system, so no banana plant can resist any fungus.: Plants do have defenses, and some banana varieties resist this fungus; this one did not.
- Cuttings carry the fungus from parent to offspring, so each clone started life infected.: Infected cuttings can spread the fungus, but clean plants in infected soil fell ill too; no plant could resist it.
- Correct: Every plant had the same alleles, so none had a defense against the fungus.: Correct: no genetic variation, no resistant individuals.
Part 9 · Summary
Summary
Biodiversity is the variety of life at three levels: the alleles within species, the species in a community and the ecosystems in a region. Ecosystems with more species and more genetic variation tend to be more stable: they lose less when a drought, disease or other disruption strikes and recover faster, because some individuals and species tolerate the stress and take over the jobs of those that suffer. Species do not matter equally. A keystone species has an effect much larger than its abundance; a predatory sea star that eats mussels keeps the mussels from crowding out other species, and removing it lowers diversity. Foundation species such as kelp, corals and forest trees build the habitat others need, and ecosystem engineers such as beavers reshape it. Producers set the energy available to every level above. People depend on biodiversity for ecosystem services such as pollination, clean water and flood control. Simpson's diversity index puts a number on species diversity so that communities can be compared.
Part 10 · Up next
What comes next
Part 11 · Connections